

Strength
Strength • March 27
Things are firming up – is the market climbing a wall of worry? Bear market rally? I’m looking for a retrace (forming a higher low) – which is what you want if you’re hoping for a healthy move. The return of the meme stock is concerning. The continued oversold-growth-stock rip doesn’t feel incredible. Kind of cherry-picking, but I won’t be chasing up here.
Charts
*Disclaimer: While in the markets for over a decade now, I haven’t been drawing on charts but a few years. I’m not a technical analyst, just a trader/investor who enjoys technical analysis. There is no value in drawing a bunch of indicators all over a chart. I’m just having fun.
Charts • March 14

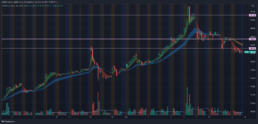
Quick start with oil. Drew these weekly levels going back to 2008 a few weeks ago. It still amazes me today how large volume levels left on the chart affect current price….regardless of how many times it works. Hourly chart blown up to display price interacting with the levels.
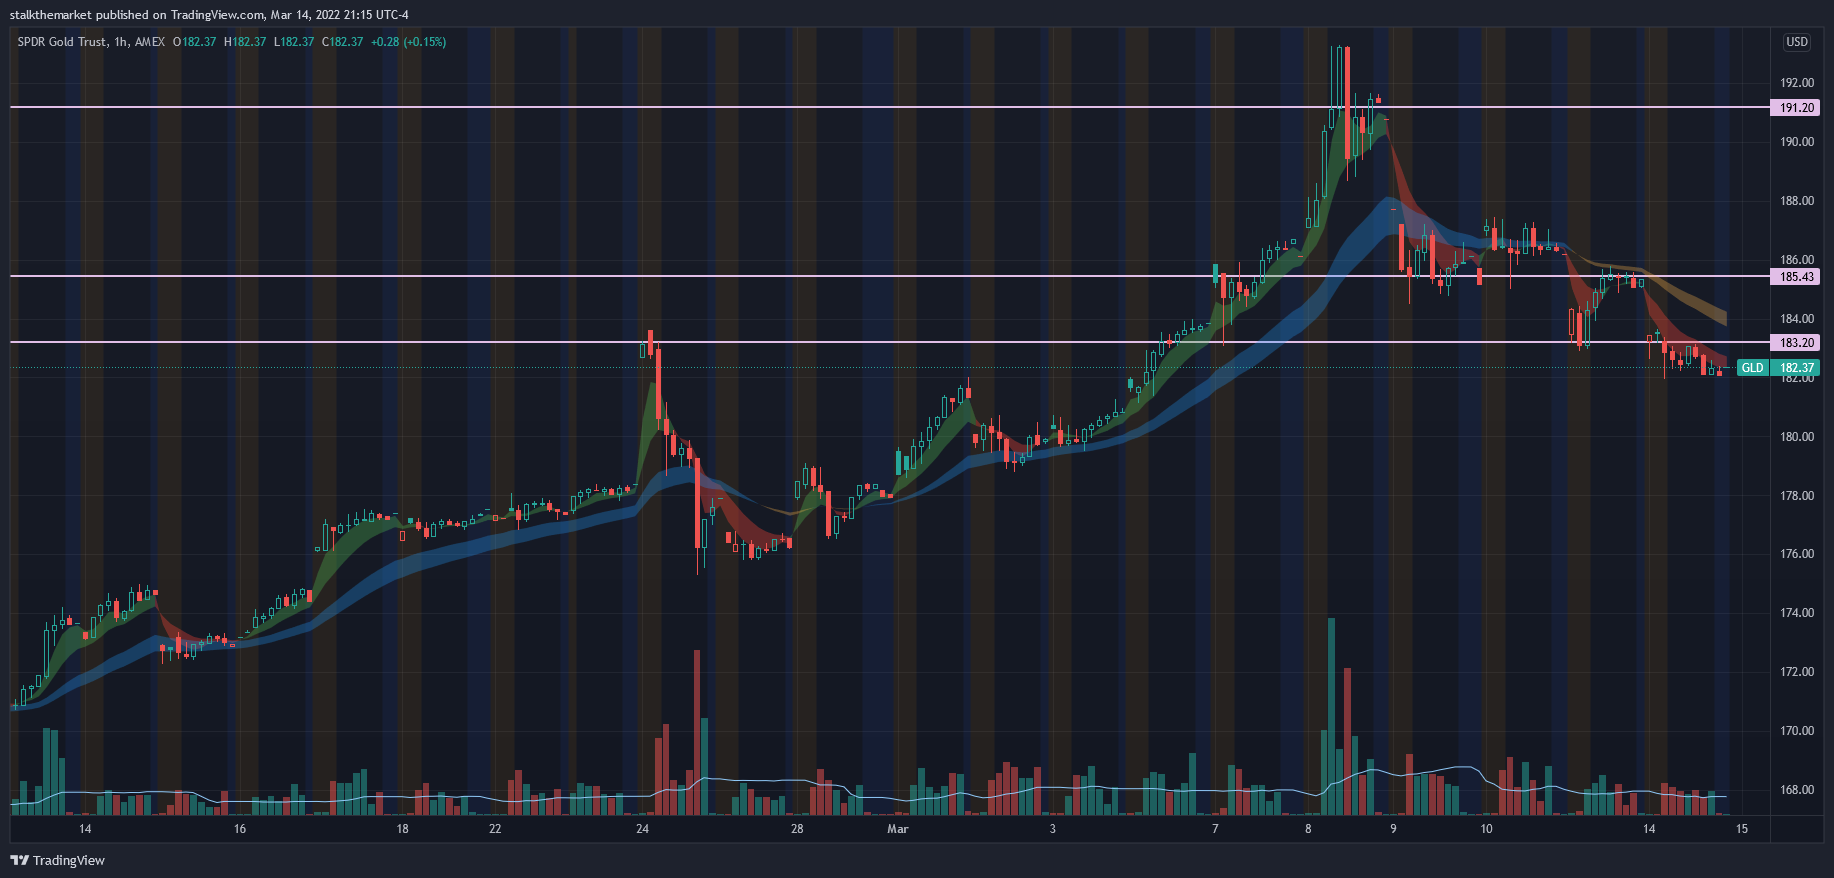
Quick on gold – today, I drew these weekly lines going back to 2011 & Aug 2020. Furthering the point in one of my favorite chart drawing concepts I learned a couple years ago. “Look left,” as they say. Hourly chart.
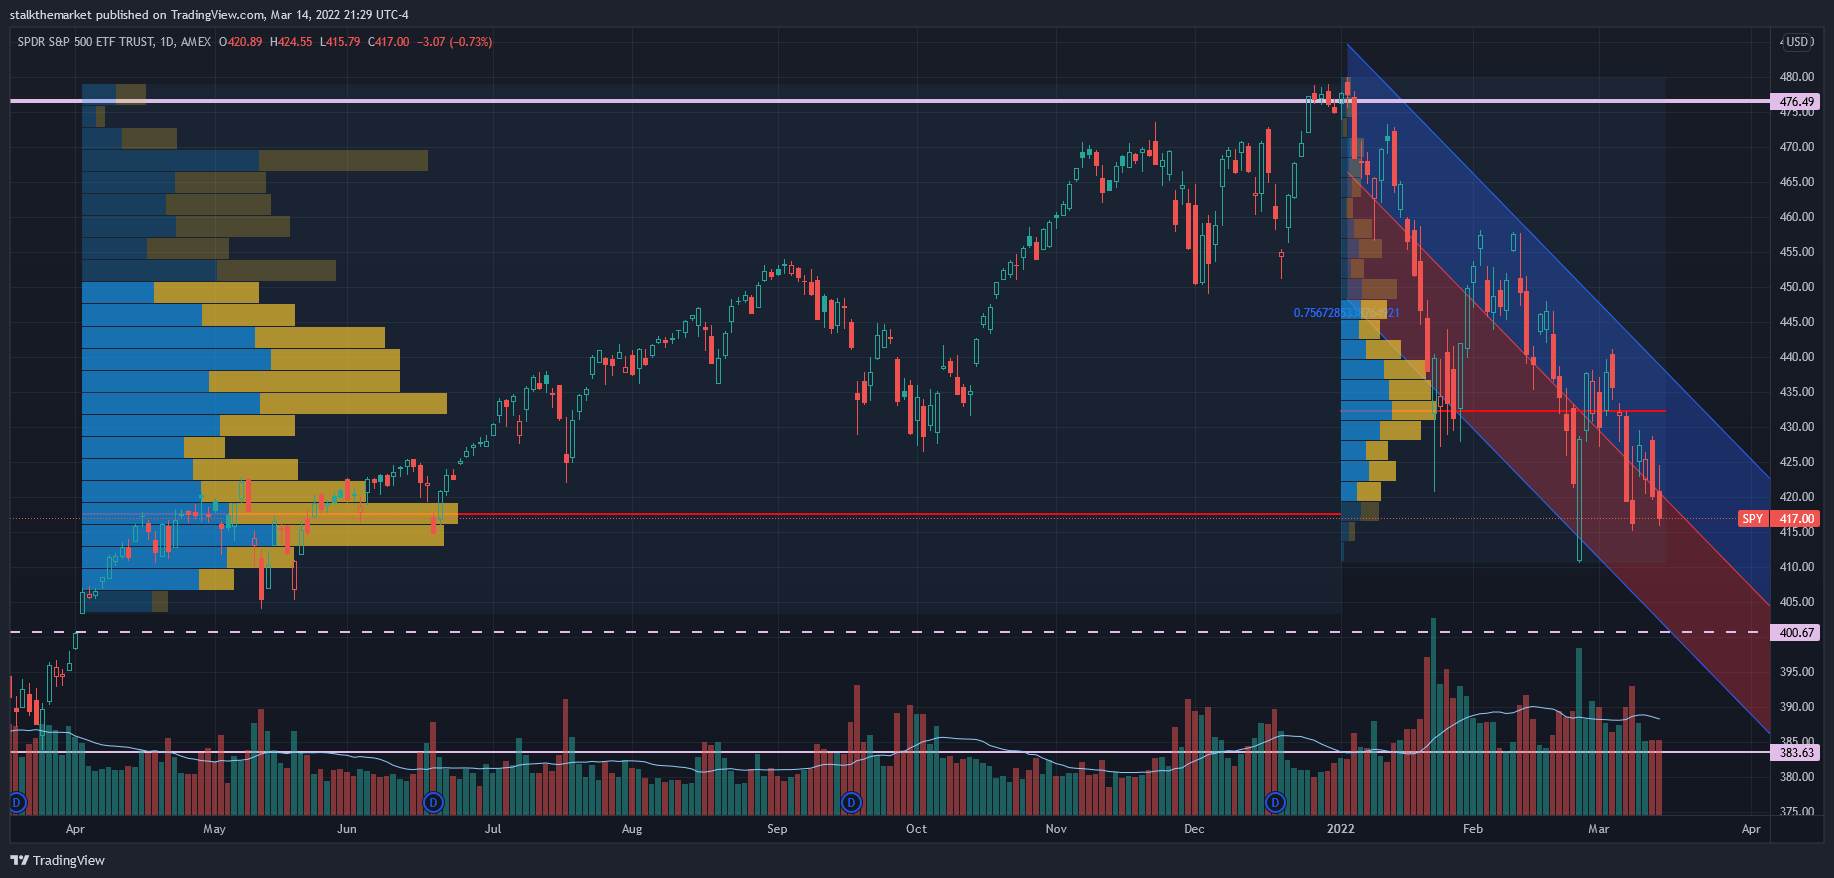
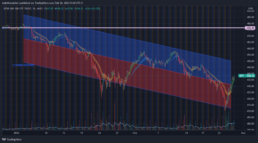
OKAY SPY. I got really cute with this chart – bear with me. First, I don’t think drawing junk all over a chart brings impact, if nothing else, it is unnecessarily distracting. The blue/red channel is one I drew a few weeks ago, just extending the right of the channel on the chart. Volume profiles display volume interacting with price points over the period you’re viewing. I drew two: The breakout in April 2021 through year end (Left), and YTD (Right).
Not necessarily a realistic indicator of demand and supply, consider it a chart of where the bodies lie. I started learning Volume Price Analysis a few years ago – the art of reading candles and volume alone. The volume profile is an applicable part of this process. Notice how the prior Volume Point of Control (VPOC – solid red line) lines up almost perfectly with current price (thin dotted red line).
Things are breaking down. Rothschild: “the time to buy is when there’s blood in the streets.” While a true statement, I’d prefer to miss a little upside waiting for clarity, than attempt to perfectly catch the ‘bottom.’
Bear...ish?
Bear...ish? • March 4
Russia. Fed. Oil. Dollar. Volatility. Oooh the bears are coming out of the woods. Not necessarily a sadistic view (human perspective on the events in Europe aside – we’re talking markets), but the negativity is beginning to feel comforting. The ebullience of up and to the right charts doesn’t have the same effect on my comfort. Volatility shakes out weak hands; strong hands in terrible names pay the price. Great quote – there is no bad weather, only bad clothing. If your names are junk (in a rising rate/geopolitical volatility-gripped market), you’re wearing them.
No need to be slow on the oil move, my call last week was blown out on MONDAY. Woof. She’s going higher too – new lines added above (monthly and 1 hour charts).
Bearish trades abound, with the ripping dollar and surging gold prices. Bye bye bitcoin, your safe haven/inflation hedge is a risk asset in sheep’s clothing.
Here’s the beauty of markets – we won’t know how much of the move in gold and the dollar is a result of Russian capital flows, and how much of it is a bearish investment bet until we see the other side.
Weekend check (we could get cute with charts, but there are plenty of charts we could play with); approximate levels:
- WTI Crude: 115
- Gold: 1970
- US Dollar: 98.5
- US10 Yr Yield: 1.73
- VIX: 32
The volatility in all markets have been astounding. Stay safe, my friends.