
Trap • May 6
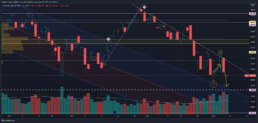
The yellow arrows proved to be a lucky call. Once I put something on the chart, it remains in its original form and eventually gets deleted. I’ll leave all the junk on the chart to see how well my perceived trends persist.
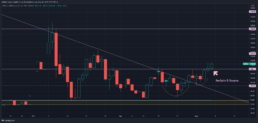
The market firmed up from the recent lows early this week, then ripped following the Fed minutes on Wednesday. In the press conference, Chair Powell said a “75 basis point increase is not something that the committee is actively considering.” I think we saw a short covering rally following the release, trapping bulls into near-term supply (SPY ~428). The market sold off after digesting the news and cluing into the fact that Powell backed himself into a corner. Sure, he can walk back on his comments, but they didn’t warrant the velocity of the Wednesday afternoon move. S&P500 put/call ratio above 1.5 spells short covering to me.
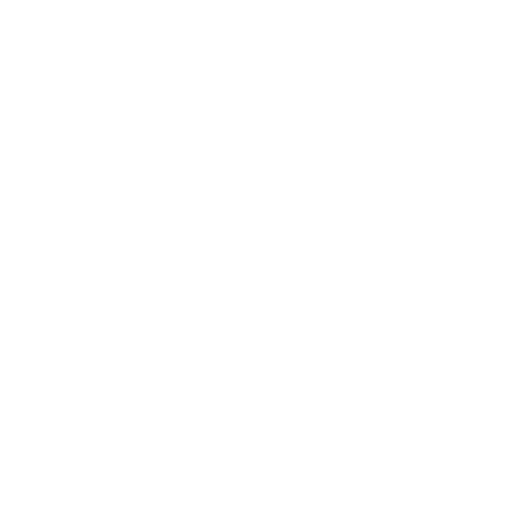
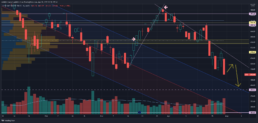
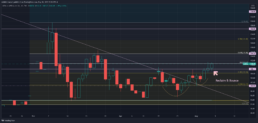
Zoom in – remember, multiple time frame analysis is important if you’re more active than the strict buy-and-hold type. A dip Monday afternoon near my early year downtrend channel was bought up quickly. You can see we failed the 428 SPY level AGAIN into the close Wednesday. This is the third attempt in the past two weeks. CPI data this coming Wednesday. Barring unexpected numbers, I think we see yet another test of the ~428/430 level, and possibly a move to 440 (through yellow channel).
It’s pretty binary. It seems like everyone wants SPY 400…which means 395 (large volume band), and I’ve had a weekly 383 level on my chart for months. I think this precise scenario actually plays out over time, but it may occur swiftly with volatility so strong.
Oil – the equity charts are pushing new highs as oil lifts to 110. Last week it appeared to me that the WTI chart was weakening and the equities may roll with everything else, yet they firmed up well in the face of overall market volatility this week.
I wouldn’t be talking about oil this time a year ago. The best performing stocks YTD: oil companies. Reasonable valuations, strong earnings, (debatable) macro tailwinds, constrained supply dynamics, etc. I traded oil equities on the desk in 2014-15 when oil went from approximately 100-30. Despite its relatively small proportion in the S&P, it is an incredibly important group.
Oil is the kingpin of commodity assets. Various macroeconomic conditions impact supply and influence price. Oil and the market don’t have to trade inversely, although they may in large swings. When oil prices rise to these levels, consumers are constrained, further crimping the economy. Supply dynamics (sanctions on Russian oil) are a tailwind for price. US growth concerns (upcoming recession? Seems like everyone now knows about yield curve inversion) are a headwind for price. China’s covid closure is also a headwind. (Note, China’s closure is also a contributing factor to overall inflation as [not oil, yet consumer & industrial] production growth is falling.)
There’s a political perspective – this is a midterm election year, and high oil prices don’t feel good as voting constituents are hurting at the pump. Sorry everyone, your government officials can’t effect the oil price.
The chart reclaimed my 108 level, which is largely insignificant when you look at the fibonaccis (fibs) on the new chart. From the breakout candle (the base of my yellow channel) to the high at ~130, you can see the confluence between weekly levels and fibs ($100 at the .236 & $115 at the .618). Current price of $110 is at the .50 level. People like to trade round numbers. I’ll save my golden ratio rant for another time, but fibs never cease to impress.
Where does it go? Feels like it wants higher. Keep an eye out – if oil really rips, it could impact your stock market relief rally. If you’re chasing oil equities up here, be tactical.