


Education
Education • August 27
Building an AAPL daily chart
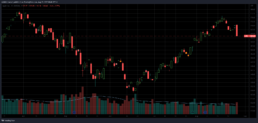
- Volume Point of Control (VPOC) – highest volume bar in the histogram
- Value Area – 70% of the volume within the histogram, bracketed by the:
- Value Area High (VAH) & Value Area Low (VAL)
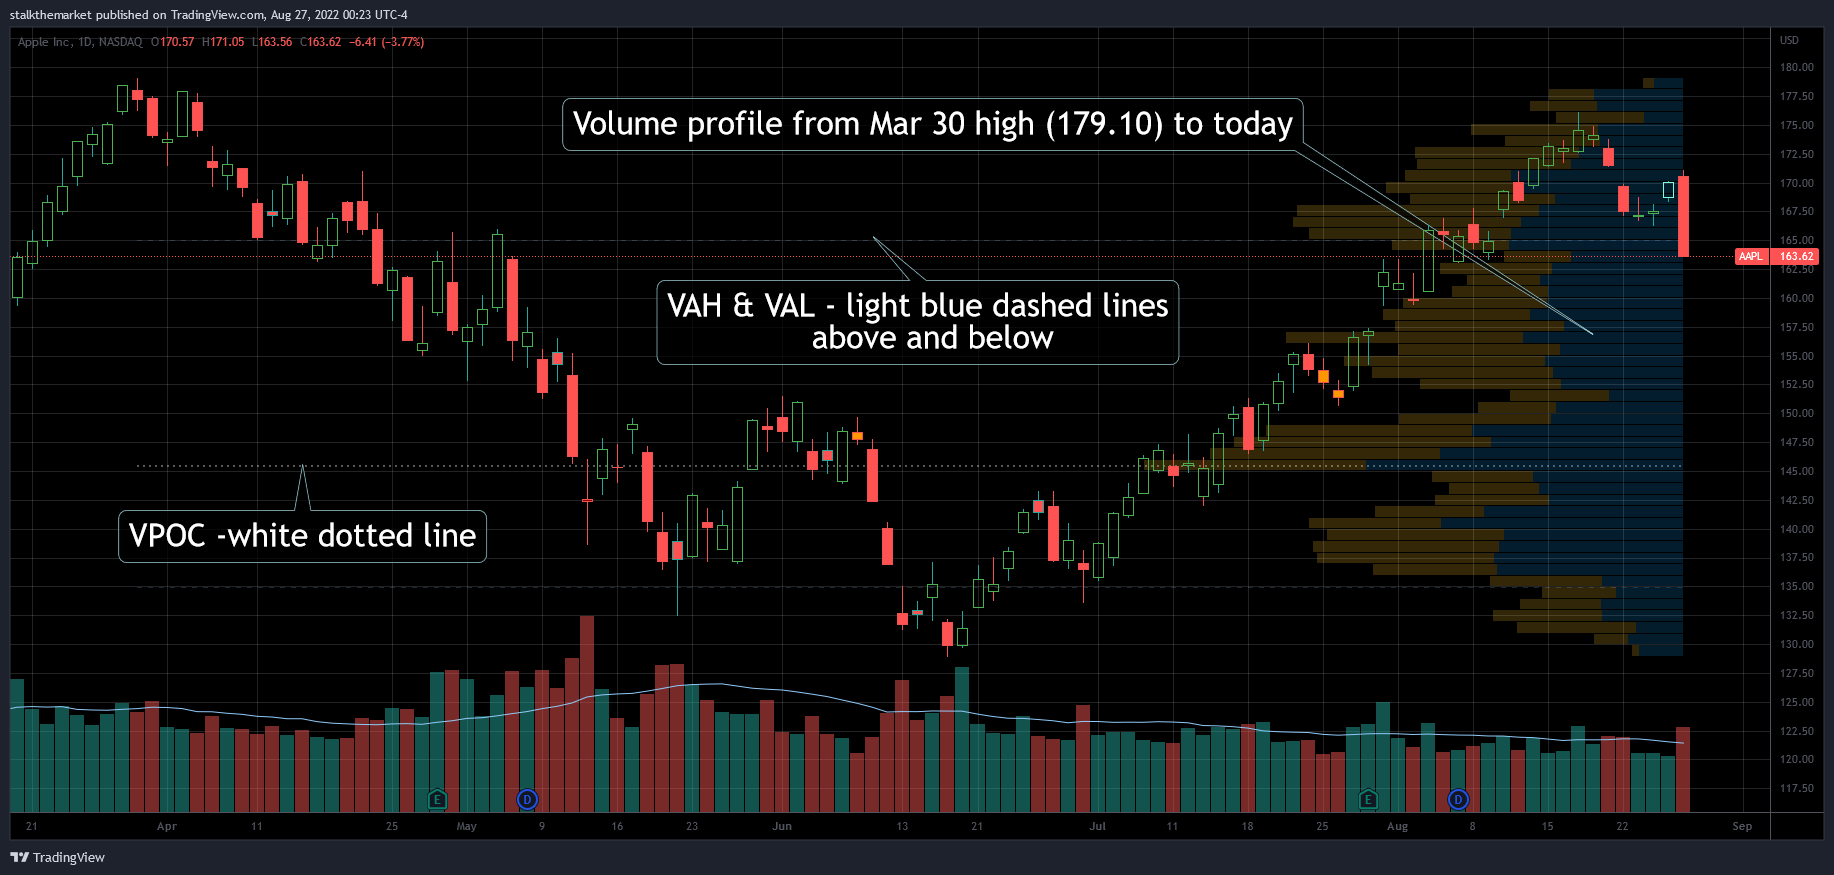
- Simple (SMA) – average price of timeframe specified
- Exponential (EMA) – a higher weight of recent prices calculating the average
One could argue both, either, or neither SMA/EMA levels are valid. The 200 day SMA (mean of the last 200 days) is a highly psychological long term trend commonly discussed in financial press. My favorite EMAs are the 9 & 20. I like shading between the EMA spread, creating clouds – a visual tool that slaps you in the face with a trend.
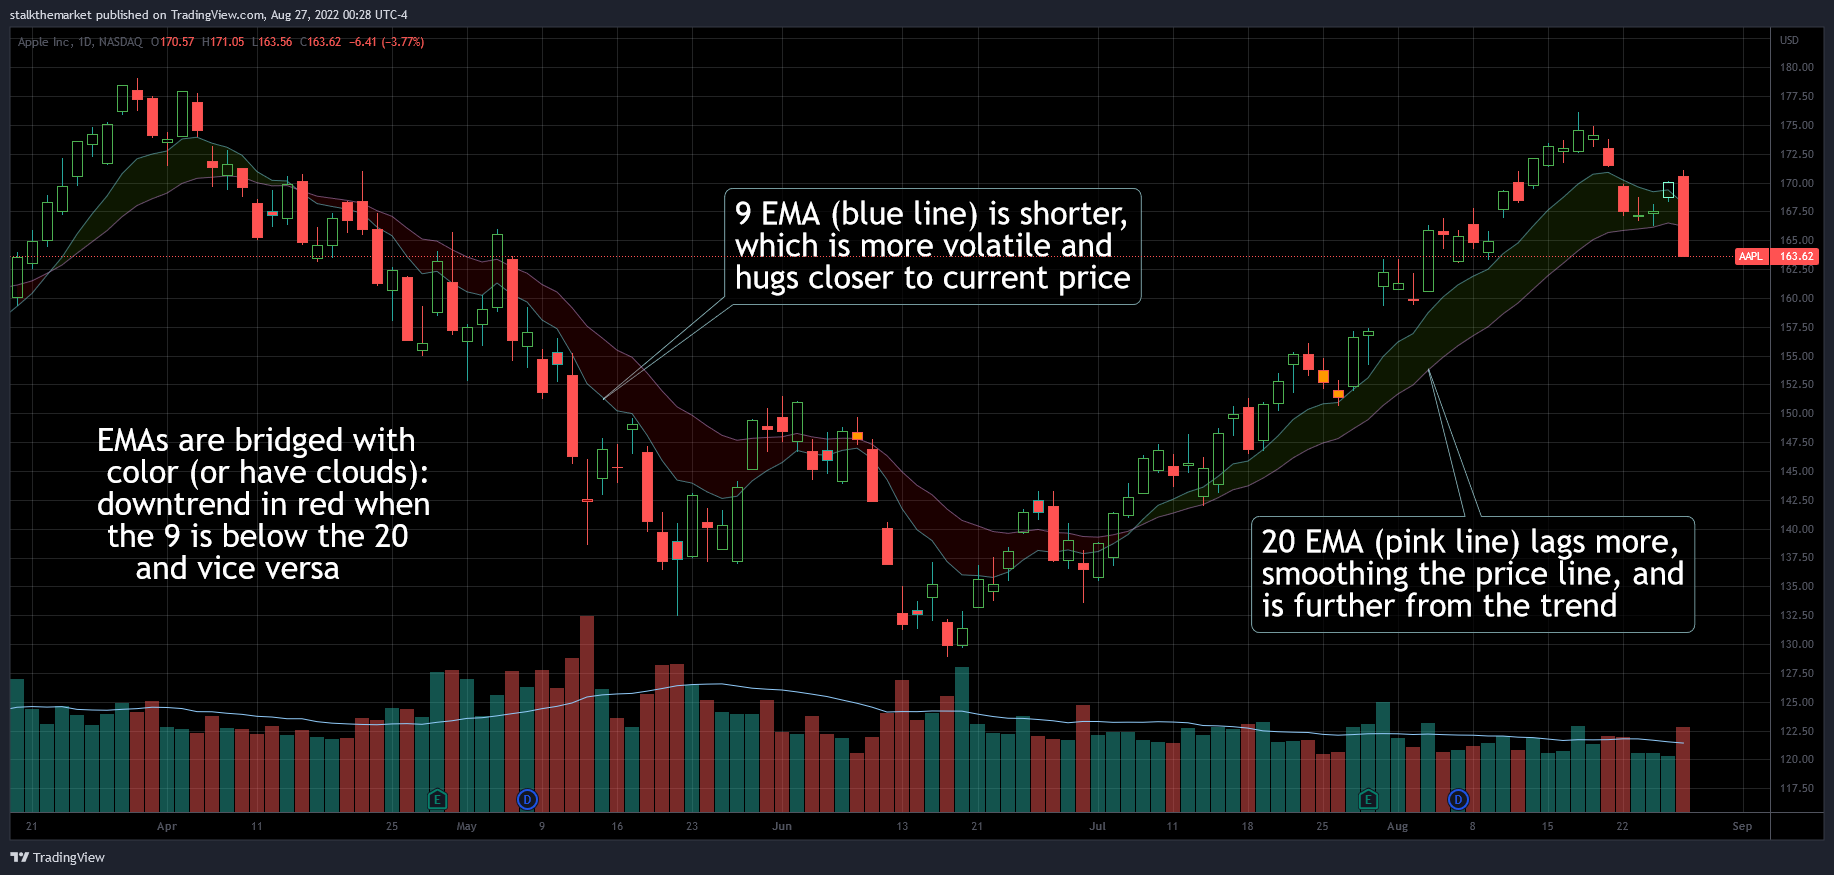
Fibonaccis are a set of ratios based on the numerical sequence. Named after the Italian mathematician who brought the ancient Indian study home, fibs [as they’re called] are an incredible tool. I plan to opine on the subject in another post.

(slide picture left to right)
Putting it all together looks kind of busy, right? Or does it add context? Using only a few tools helps to filter out the noise. That’s why I like to have my annotation color settings in higher transparency. Otherwise, it’s best to just do it naked. Always good advice.