

Result
Result • October 2
This post is a follow-up to “Education,” where we built an AAPL daily chart and explained concepts referred to here.

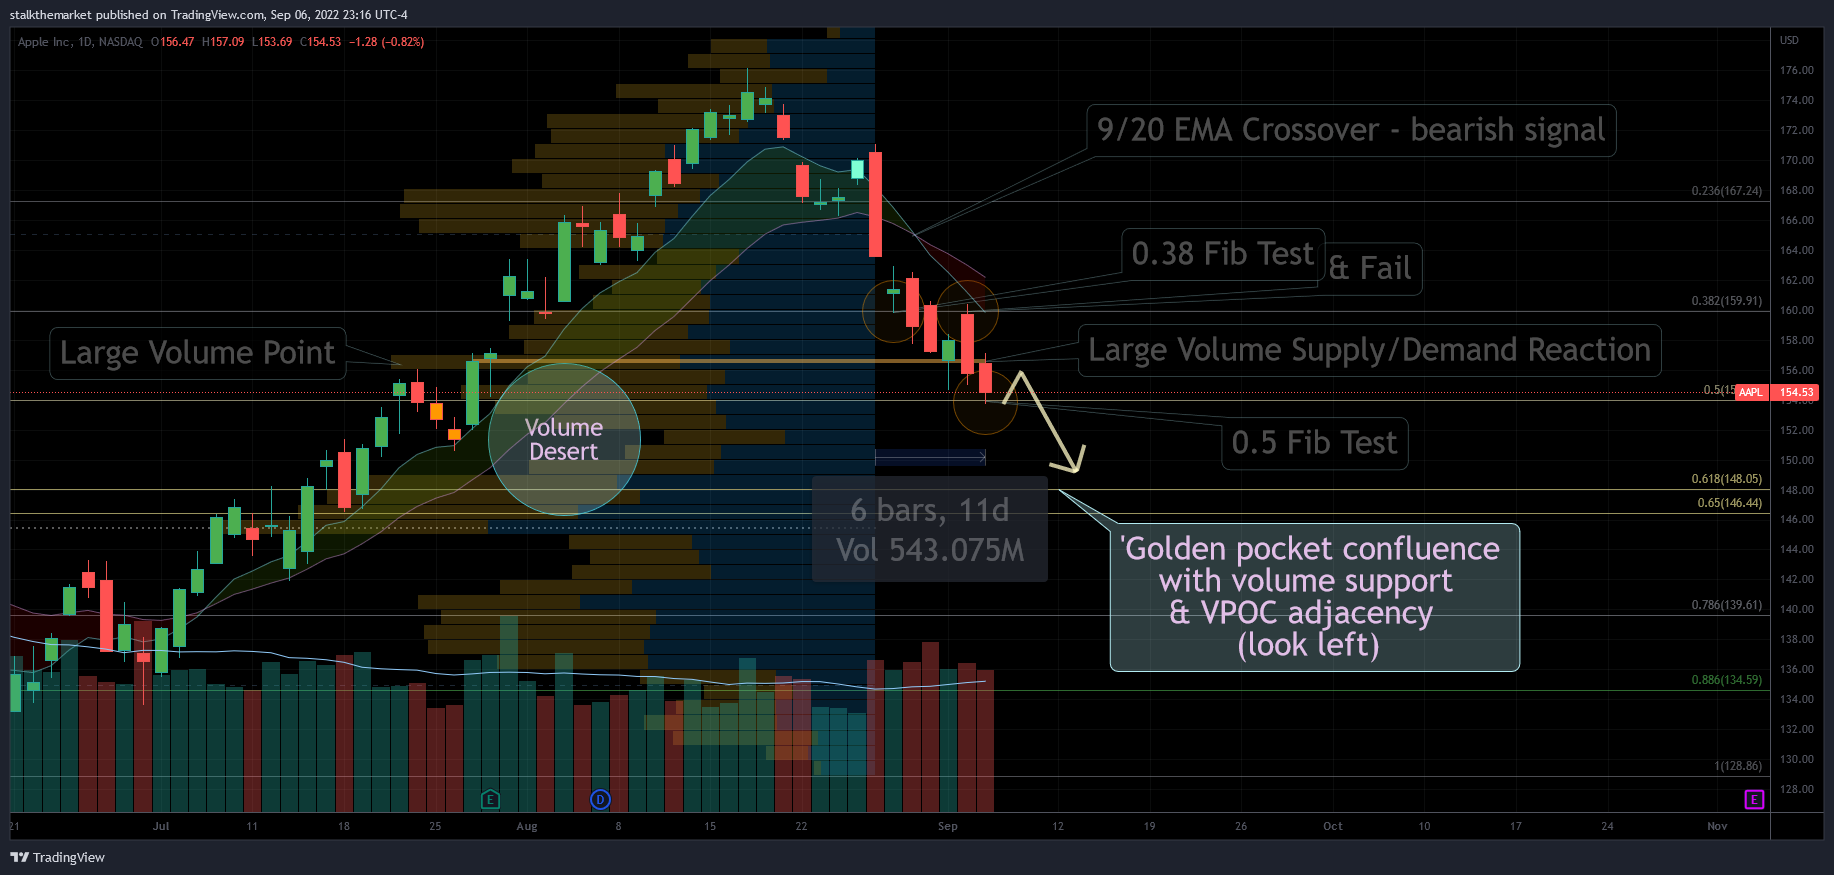
Here is the August 27 AAPL chart built with EMAs, Fibonaccis, & Volume Profile. I thought it would be helpful to review the results and see how the tools work.

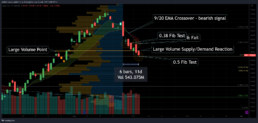
The annotated chart above from six trading days later on September 6.
EMA Crossover – the bearish signal of the shorter EMA crossing under the longer EMA turns the cloud red. The trend flip occurs many days after the recent peak because EMAs are lagging indicators.
Fibonacci ‘Tests’ – note the candle interactions with Fibonacci levels, and look for confirmation of the level holding. Note the .38 tests & fail, as well as the .50 test.
Volume Pivot – The large volume shelf on the profile (static from Aug 27) serves as a pivot from support to resistance on the last candle. In the top chart, the last candle pushed down through a volume node on significant volume. The target would’ve been the next volume node below it. You don’t need to wait for an indicator to point out that idea when using VPA.
These tools identified the target. My eyes were immediately drawn to the golden zone (.618-.65 fibs), a key retracement area for fibonacci traders. The ‘volume desert’ (low volume region on profile) above the zone was another useful signal. That volume gap was also supported by the VPOC (highest volume in the histogram). The areas together – VPOC & golden pocket – showed confluence, strengthening conviction in the technical target.

Disclaimer: I’m not short AAPL (prefer SPX puts). I wasn’t, nor will I ever recommend you do anything with your money.
These tools informed a bearish thesis on AAPL with a target of the golden pocket & VPOC. A bounce out of that region on strong volume would have been a near-term bullish signal. A failure of that region confirms the bearish thesis and warrants a lower target. Every signal needs to be confirmed with follow through. One candle does not suffice.
The above Sept 30 chart reviews the Sept 6 target, 24 trading days after the original chart. Note that the EMA trend was broken only once, and the next daily candle respected the line perfectly. The EMAs were tested and held again a few days later. The golden pocket & volume point of control served as near (not exact) support for the stock on the hammer candle followed by a bullish engulfing candle. The 3rd from last candle bounced on high volume in that region. The following candle failed that region at open, and the price has been plummeting since.
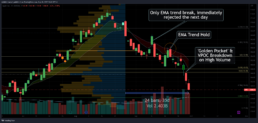
(slide picture left to right)
Hopefully I’ve understandably displayed these tools and clearly explained my interpretation of their movements. I find these tools useful, and think everyone should find tools which work for them.