
*Disclaimer: While in the markets for over a decade now, I haven’t been drawing on charts but a few years. I’m not a technical analyst, just a trader/investor who enjoys technical analysis. There is no value in drawing a bunch of indicators all over a chart. I’m just having fun.
Charts • March 14

Quick start with oil. Drew these weekly levels going back to 2008 a few weeks ago. It still amazes me today how large volume levels left on the chart affect current price….regardless of how many times it works. Hourly chart blown up to display price interacting with the levels.
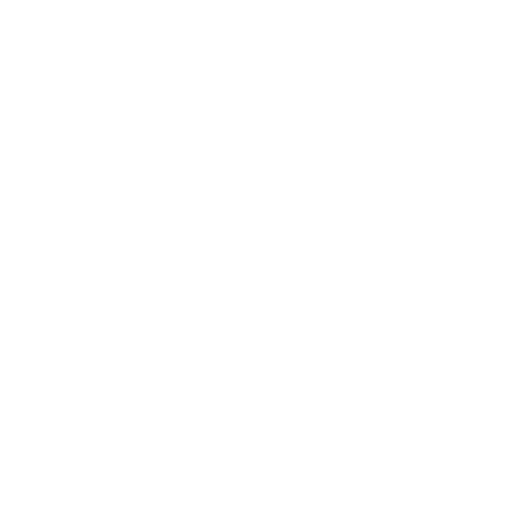
Quick on gold – today, I drew these weekly lines going back to 2011 & Aug 2020. Furthering the point in one of my favorite chart drawing concepts I learned a couple years ago. “Look left,” as they say. Hourly chart.
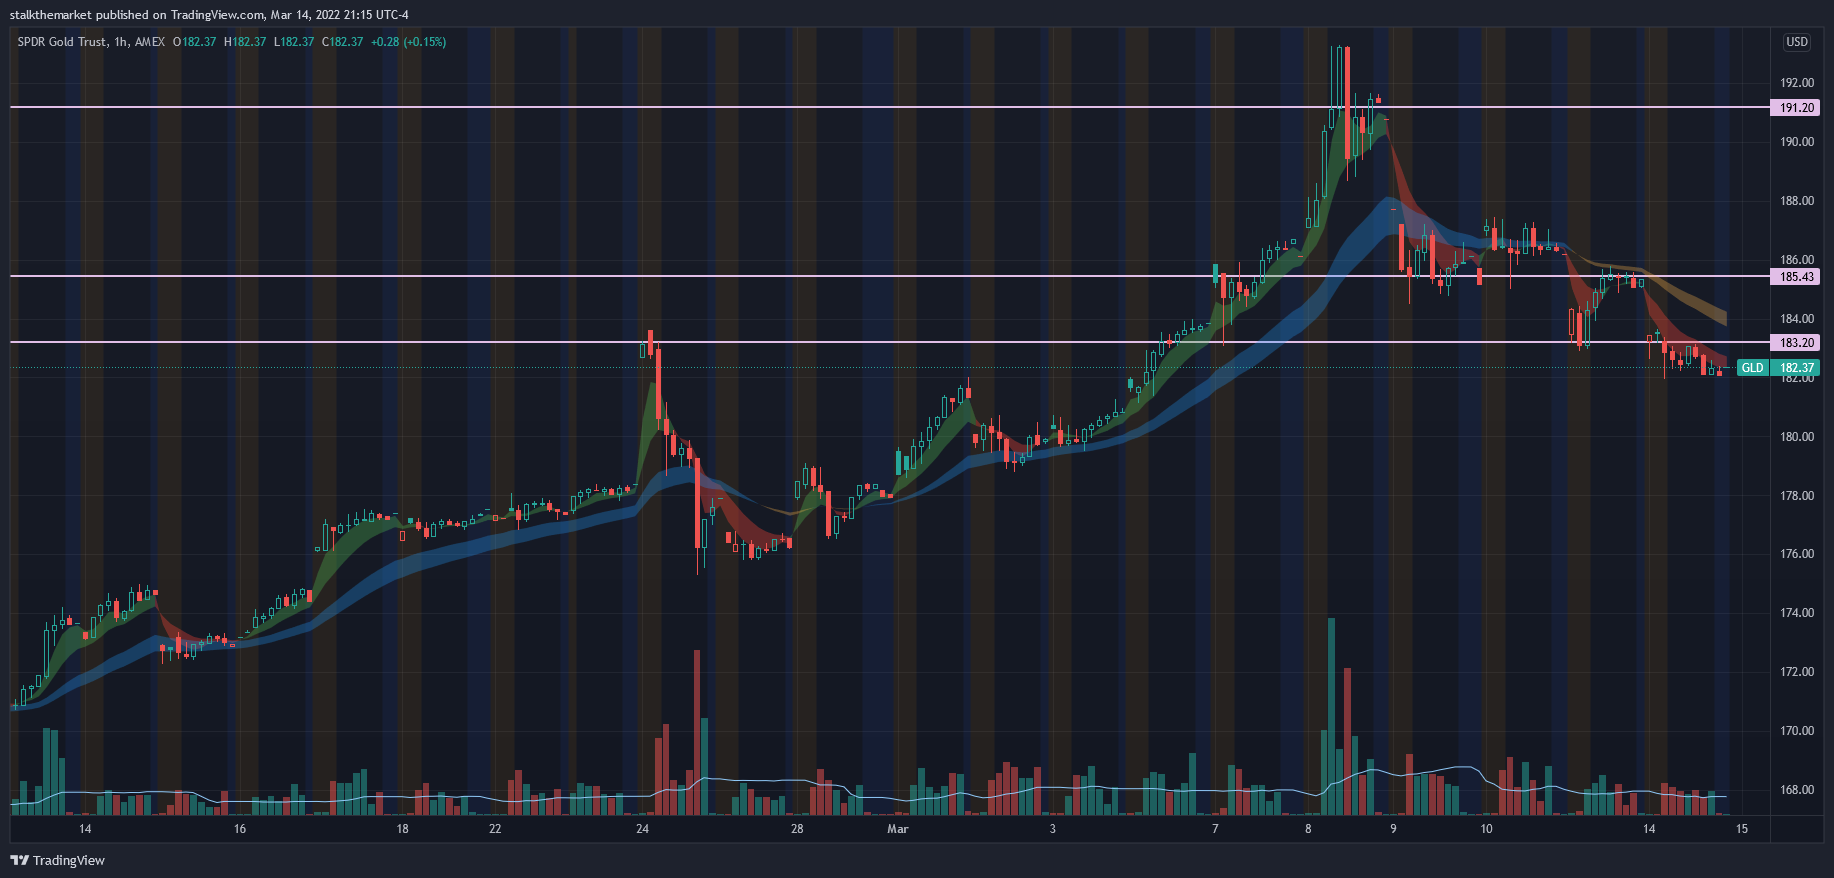
OKAY SPY. I got really cute with this chart – bear with me. First, I don’t think drawing junk all over a chart brings impact, if nothing else, it is unnecessarily distracting. The blue/red channel is one I drew a few weeks ago, just extending the right of the channel on the chart. Volume profiles display volume interacting with price points over the period you’re viewing. I drew two: The breakout in April 2021 through year end (Left), and YTD (Right).
Not necessarily a realistic indicator of demand and supply, consider it a chart of where the bodies lie. I started learning Volume Price Analysis a few years ago – the art of reading candles and volume alone. The volume profile is an applicable part of this process. Notice how the prior Volume Point of Control (VPOC – solid red line) lines up almost perfectly with current price (thin dotted red line).
Things are breaking down. Rothschild: “the time to buy is when there’s blood in the streets.” While a true statement, I’d prefer to miss a little upside waiting for clarity, than attempt to perfectly catch the ‘bottom.’
[…] had to clean up the chart – it was becoming difficult to look at. I said in this prior post that I don’t think junking up a chart with a bunch of annotations adds value. I disregarded […]