
Flag • May 13
Friday the 13th brings good tidings! Gap up and hold into the weekend feels great. We’re watching Monday for confirmation.
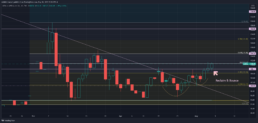
SPY revisited the downtrend from the beginning of the year; it’s easy to be convinced you’re in a bear market (I know bear = 20%, QQQ is already there). I don’t think ~385 is the low: along this ride you will see rip your face off rallies and bear flags (charting pattern of a minor uptrend within a larger downtrend which gets sold off heavily, appearing like a flag on a chart). The rest is down. Yes – things are washed out, and need to bounce. Charts work the same inversely: all rallies (up or down) need to breathe.
Okay be positive – I think this week sets up well. Let’s get a nice bear flag on a move to SPY 410. A lot of recent volume around 413 (volume profile can be an easy picture of supply/demand, but doesn’t define it). That’s your near term pivot. I got cute and copied the exact same arrows on the chart. Let’s see if the flag plays out, or if we carry through.
Note – play QQQ (ETF tracking Nasdaq 100) for beta (measurement of one security’s volatility to the overall market). QQQ beta approx 1.115, and 1.09 since covid (shout out to my boy, Josh). Higher beta (>1) outperforms the market (upside and down). Although these types of names aren’t en vogue, they are the most beaten up, which rip hardest in bear market rallies.
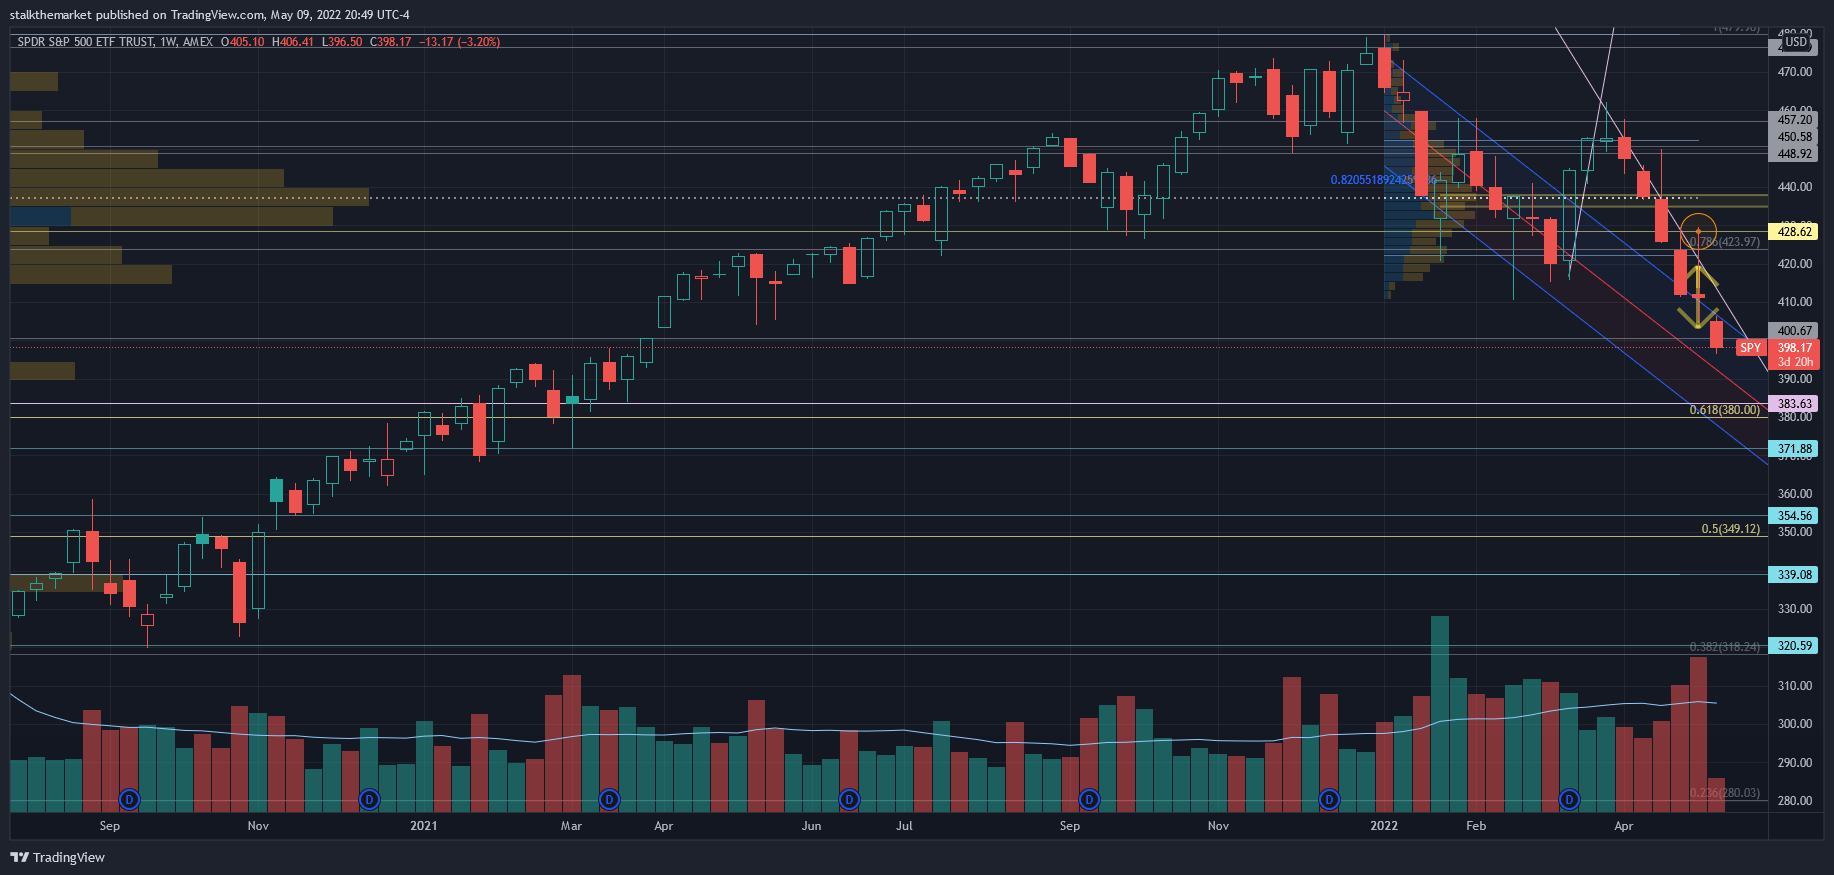
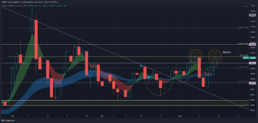
Considering the SPY downtrend resumption, I added fibonacci’s and new levels to the chart on Monday. These are theoretical…unless (until?) they’re not. Retirement portfolios prefer the theoretical case. Weekly levels are drawn around large volume points, consolidation periods, and/or interesting candle wicks.
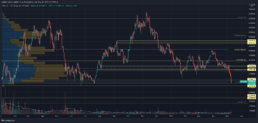
Oil – yet another retest of that 110 level. What I thought was another test and breakout of the 108 level proved to be resistance at 110, the .5 level on the fibonacci. I still think you see a breakout here. Remember, impending China open (whenever that may occur), is a tailwind. Look at the equity charts, they look strong.
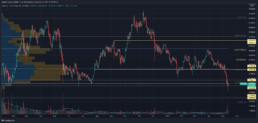
BITCOIN – FIRST BTC CHART let’s go. I charted BTC Monday when it was breaking down. It appears as if it wants to hold the weekly lows of ~28,600. Honestly who cares. It’s a risk asset which is trading in tandem with the Nasdaq. Even though Luna/Terra was a stable coin event, it proves something. Crypto is still highly speculative, and should be treated as such from an investment perspective. I’m long crypto and averaging into the dips. Crypto winters suck, and this one may last as long as QQQ bear does unless something changes. If we get a push towards 20k BTC, you apparently get margin calls on firms like MSTR, which would be structurally negative. As of now, all you can do is hope. Let’s play like it wasn’t always hope. Ehem, HODL.