
Learning • May 30
I had to clean up the chart – it was becoming difficult to look at. I said in this prior post that I don’t think junking up a chart with a bunch of annotations adds value. I disregarded my own perspective for educational and entertainment values.
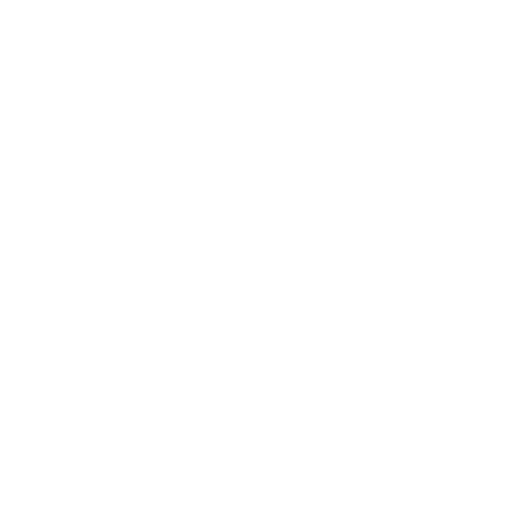
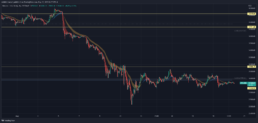
Important to note: I adjusted the regression channel. The prior trend was a ~76° angle from Jan 3 to Feb 25. The new regression is ~63° from Jan 3 to May 12. It’s only hopeful to rely on an annotation months after the fact unless you’re precisely correct.
This adjustment is an attempt to be constructive. You know the phrase describing markets as “up and to the right,” what can easily be perceived as a 45° angle. A 76° regression shapes up for a really rough market. You better hope the selling doesn’t become more aggressive.
Things are ugly, but not awful. Look at the labor market – plenty of unfilled jobs. That said, your next fear might be the housing market. If the housing market blows up, all bets are off. Bull case: basic economics. Supply is low, and as millennials [and the ‘Boomer’ population, for that matter] age, demand will continue to be high. Still, it appears the days of over-bid-site-unseen-cash-offers in the real estate market are over.
Confluence means a junction of two rivers, or an act or process of merging. In charting, confluence is the confirmation of two converging patterns. Look at the confluence on the chart between the new regression channel and the ‘golden pocket’ of the fibonacci’s (0.618-0.65 region). The dip through the new channel, which has been bought up three times prior this year, is also a clean bounce out of the golden pocket.
Capitulation means the action of surrendering or ceasing to resist an opponent or demand. A common phrase uttered in bear markets, it describes indiscriminate selling all around. I don’t think we’ve seen it in this market. I think the acceleration of this downtrend resulting from other than an exogenous factor (Geopolitical example: Putin utilizing chemical weapons) implies something seriously negative. In my view: it would entail that growth is slowing faster, inflation is increasing more rapidly, and the Fed is in an even tighter spot. Based on the recent Powell press conference and Fed meeting minutes, it appears the fragility of markets and impending wealth effect have pushed for a relatively hawkish rhetoric.
The Fed is still raising rates. I think this downtrend will endure until the data changes or the Fed is done raising rates. Quantitative tightening begins July 1 when the Fed starts to reduce its balance sheet.
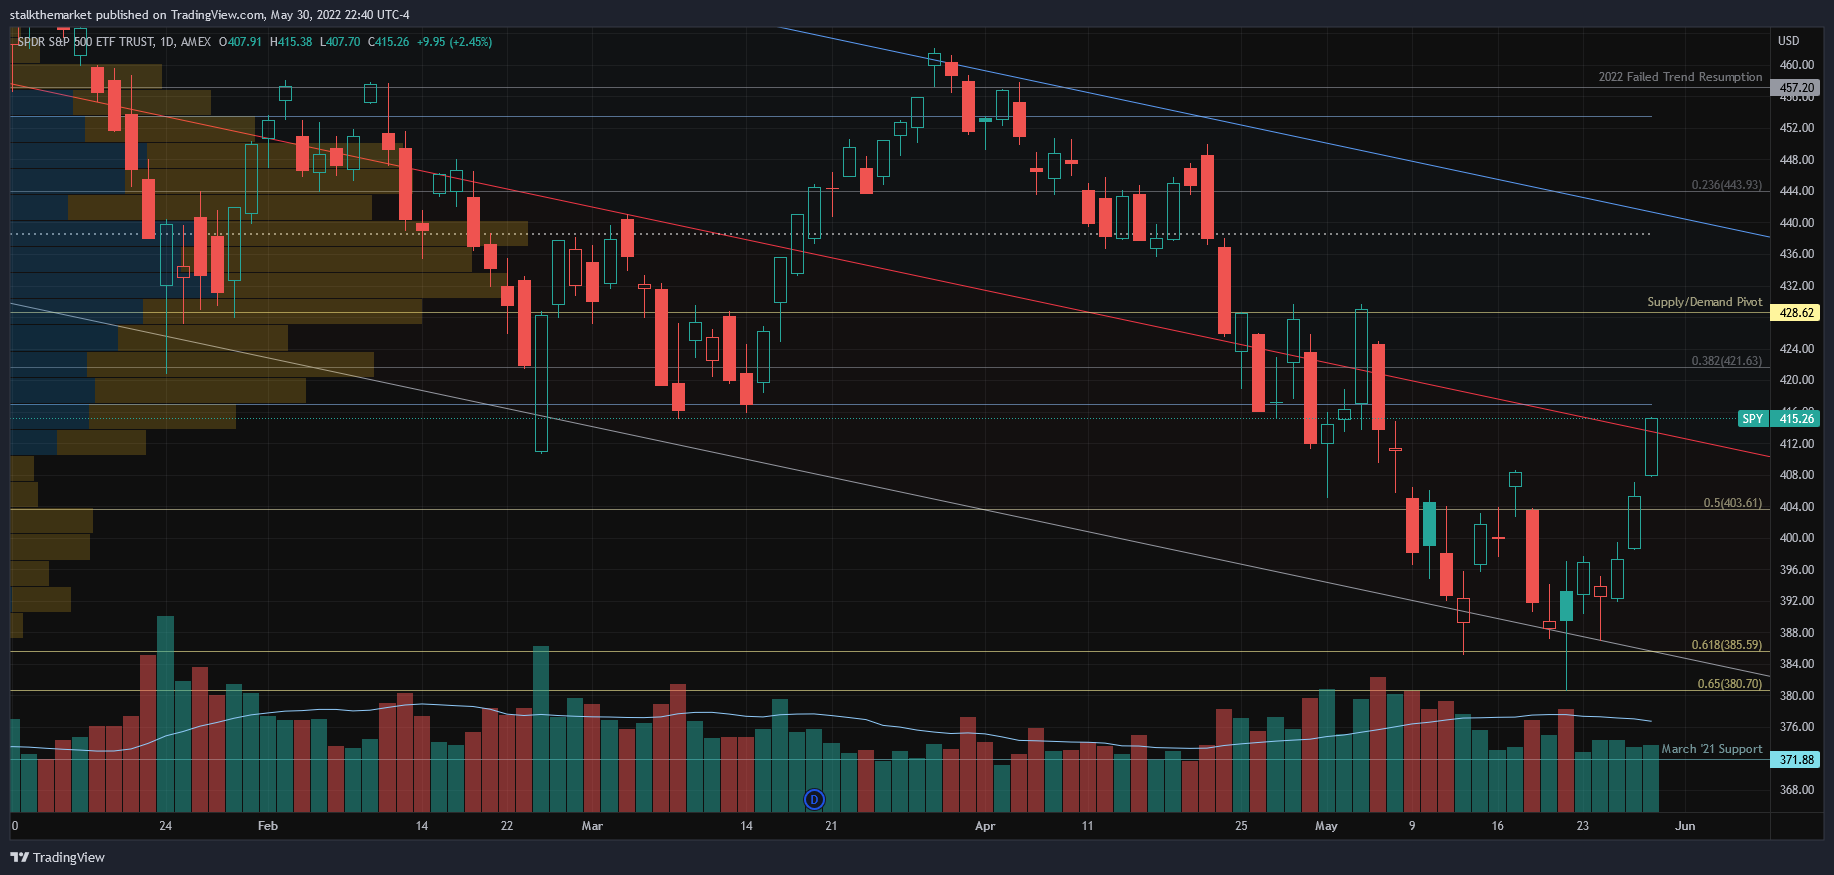
This is a weekly chart going back to the October 2020 technical breakout of Feb 2020 high consolidation. As mentioned before, the ‘golden pocket’ (0.618-0.65) [is what fibonacci fans believe] provides a good risk-reward area in a trend to enter a trade. Bulls successfully defended this region (380-385) two weeks ago. I think the market can move to SPY 420, although I believe in the defense of the ~428 resistance level. You’re in a pretty clear region at this point: 385-425.
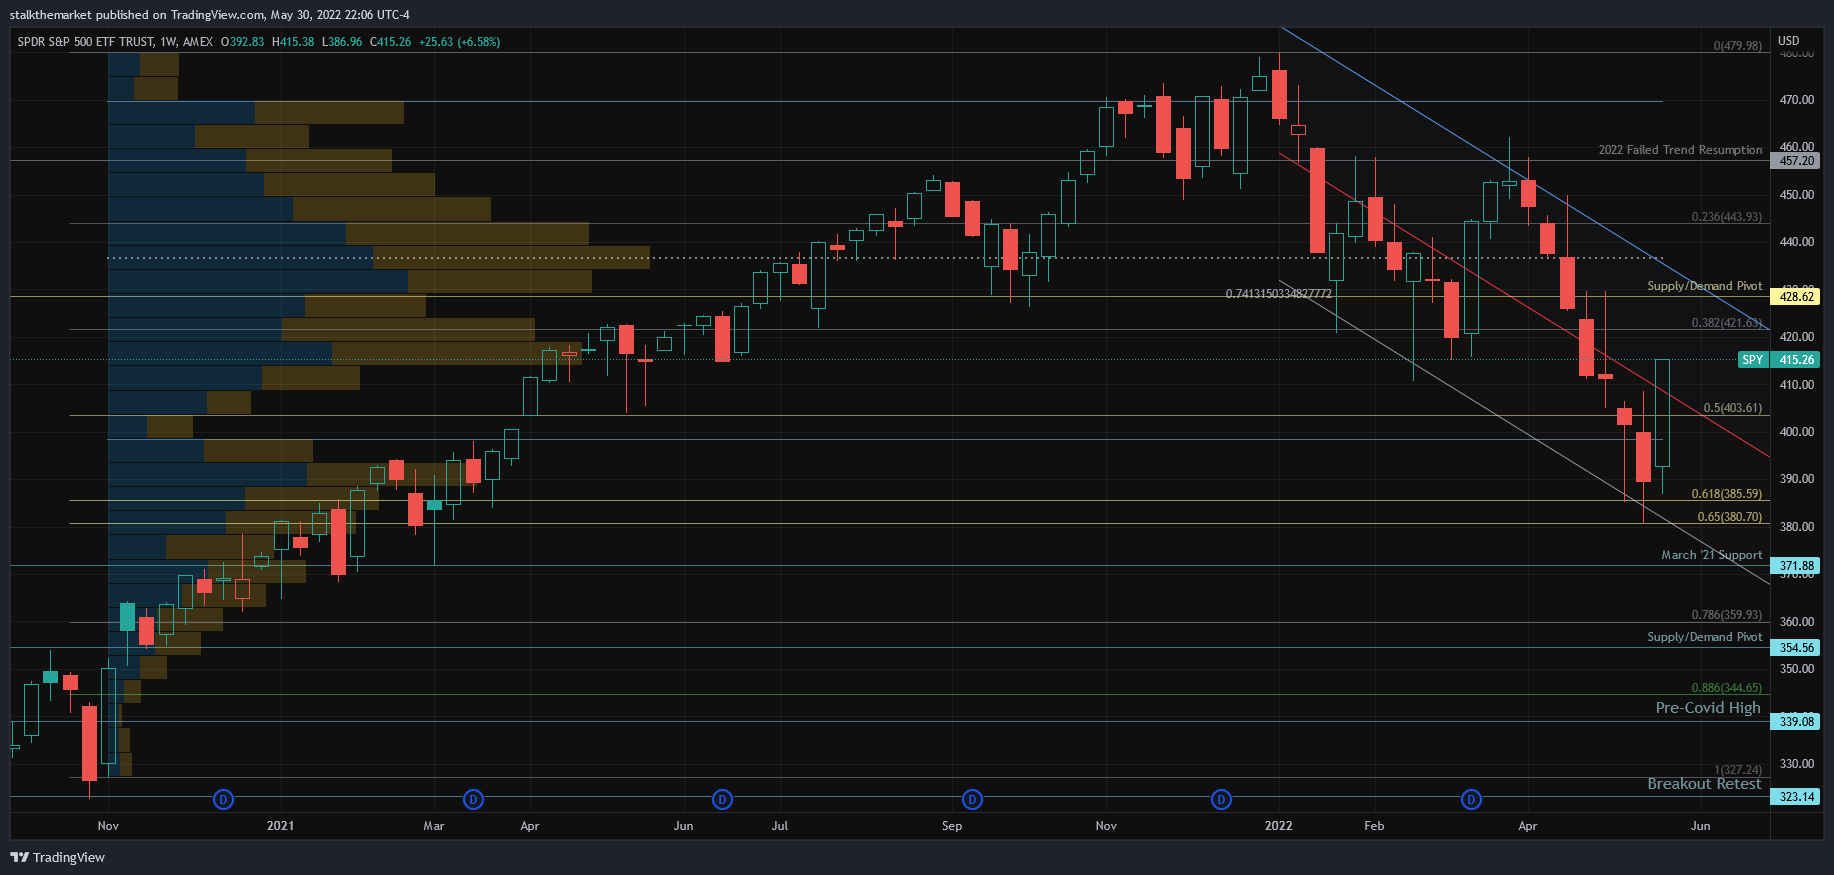
Oil
Aaaand breakout. I’m looking for 125. Remember, surging oil price is negative for hopes in an overall market rebound.

Bitcoin
Does BTC want to break out of this consolidation channel?! It shows hope for overall risk appetite in the market.