

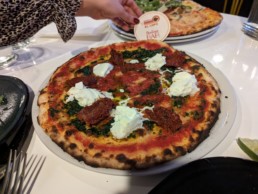
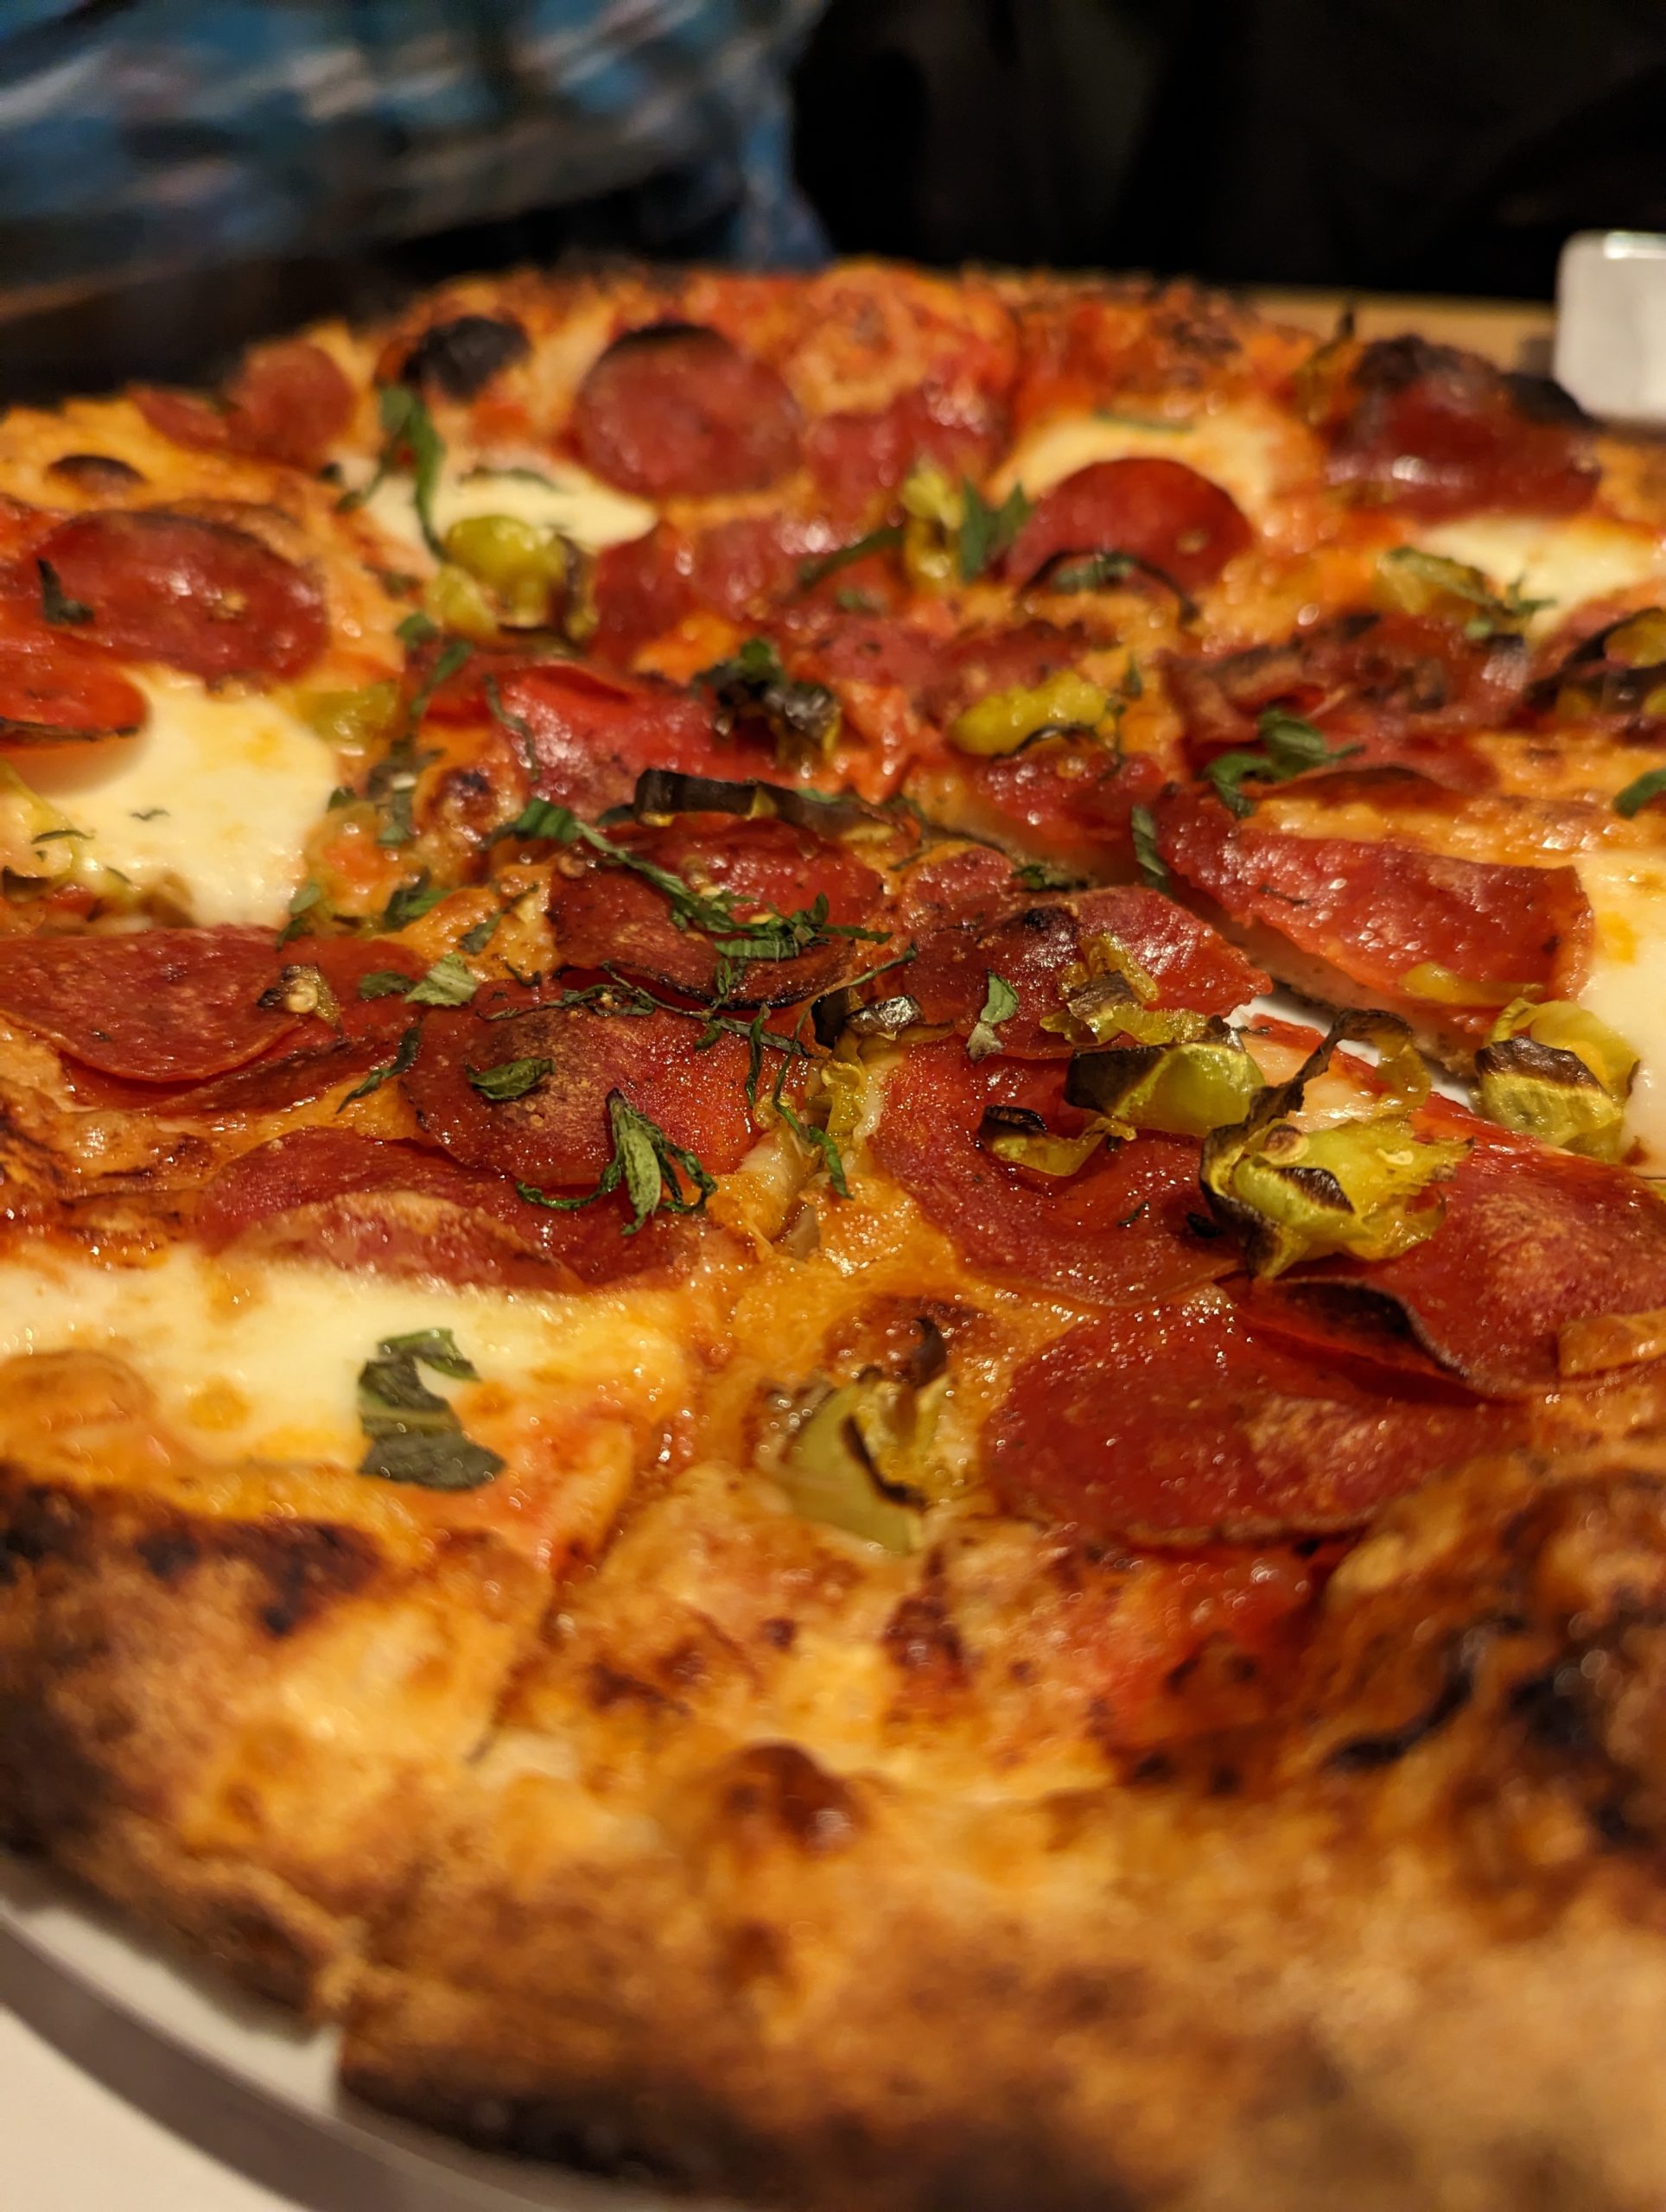
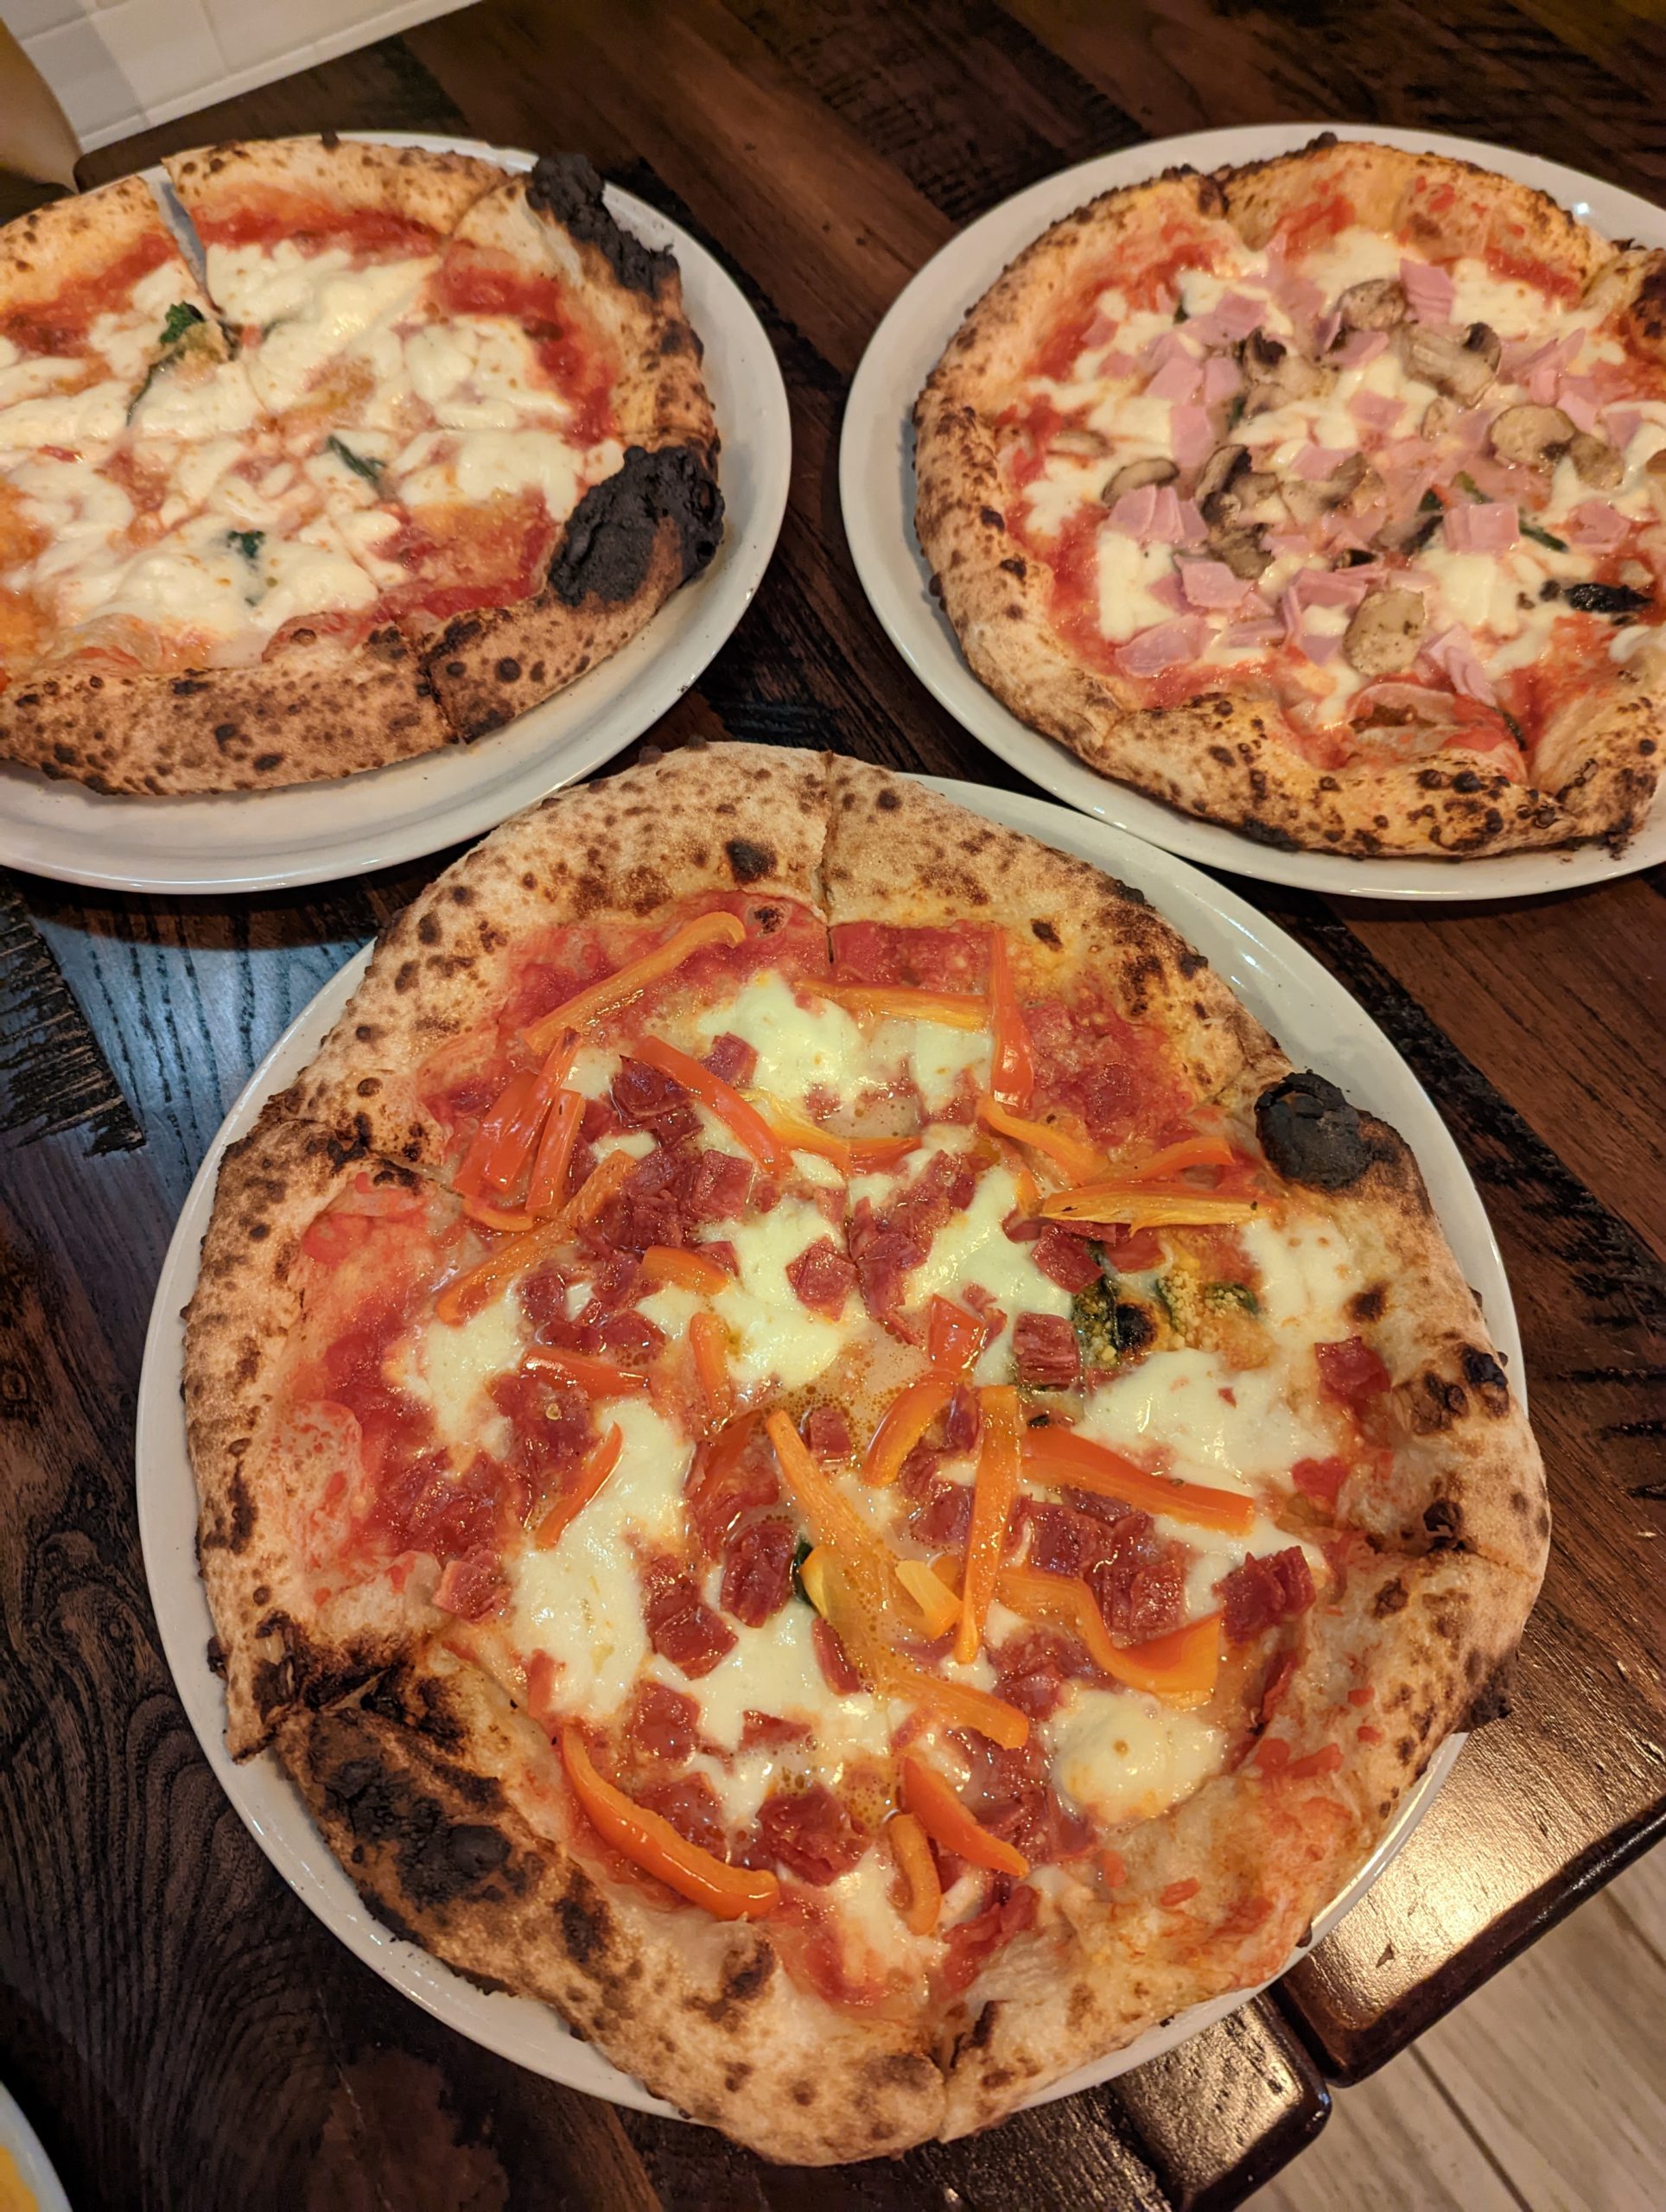
Fidela Pizza (San Juan, Puerto Rico)
∙ MARGARITA (salsa roja, albahaca fresca, mozzarella fresca, parmesano rallado, aceite de olivia) ∙ TOMATE, BURRATA Y PEPPERONI (salsa roja, tomates frescos, albahaca fresca, burrata, pepperoni, miel) ∙
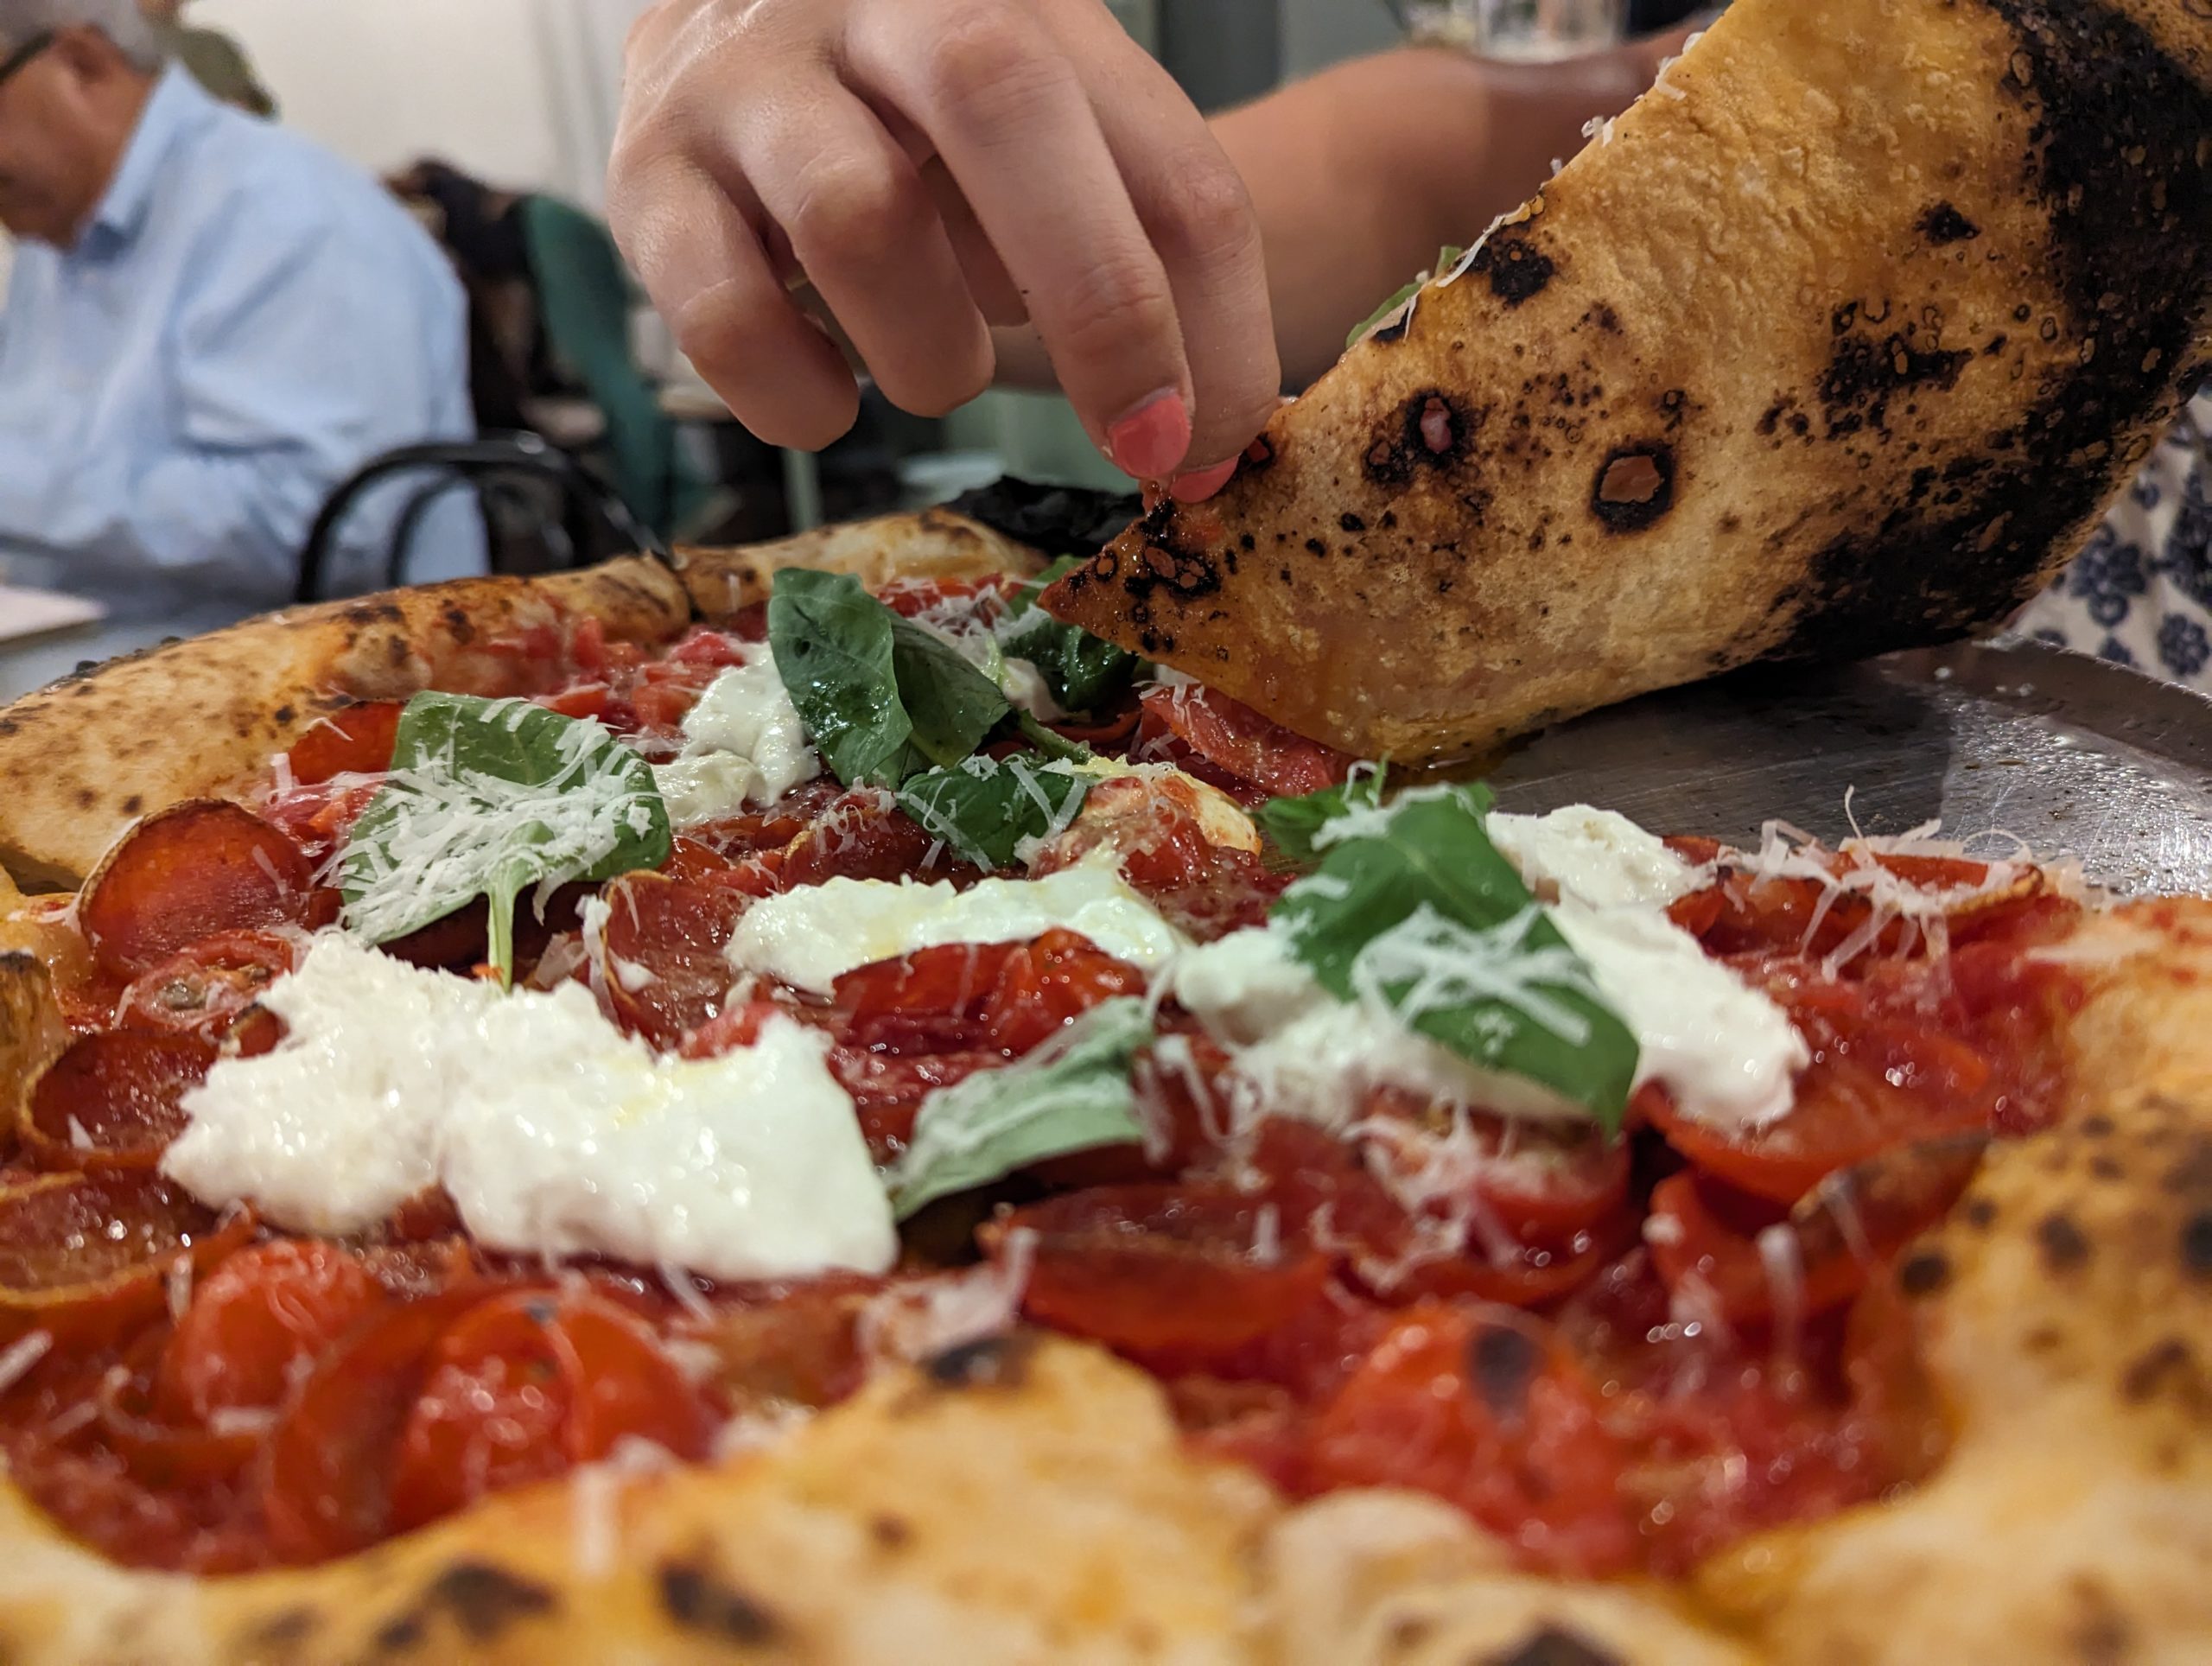
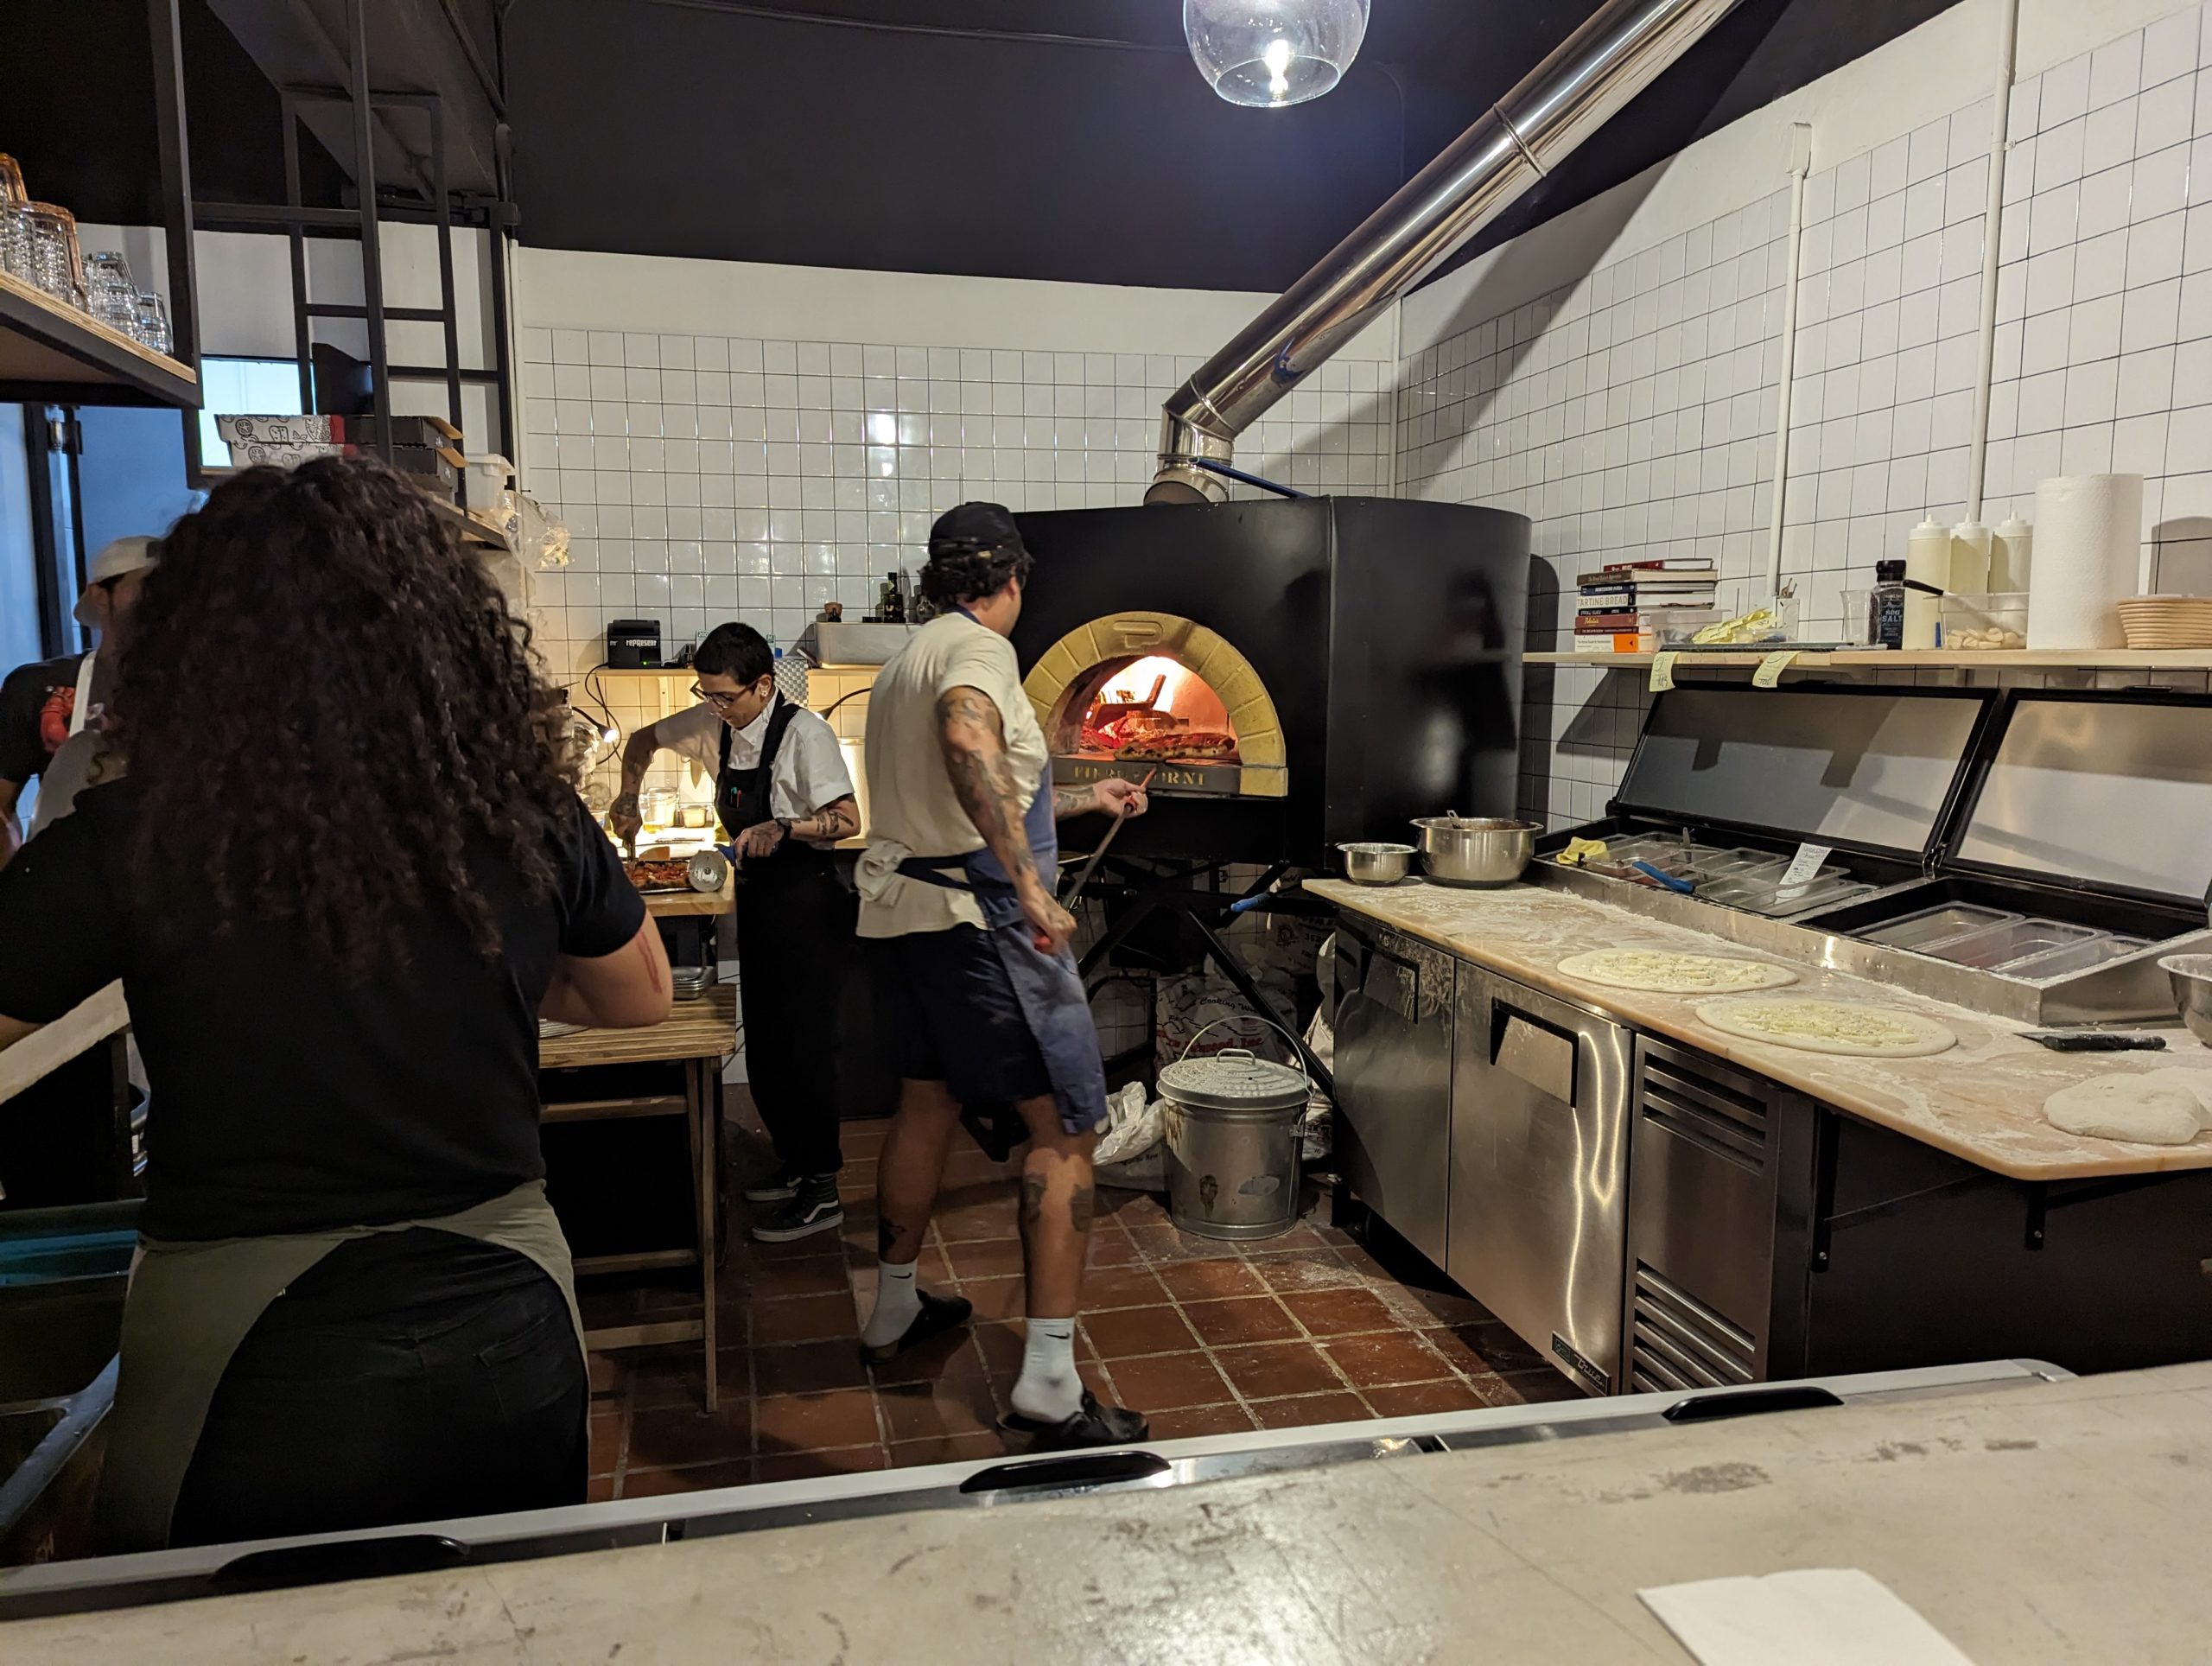
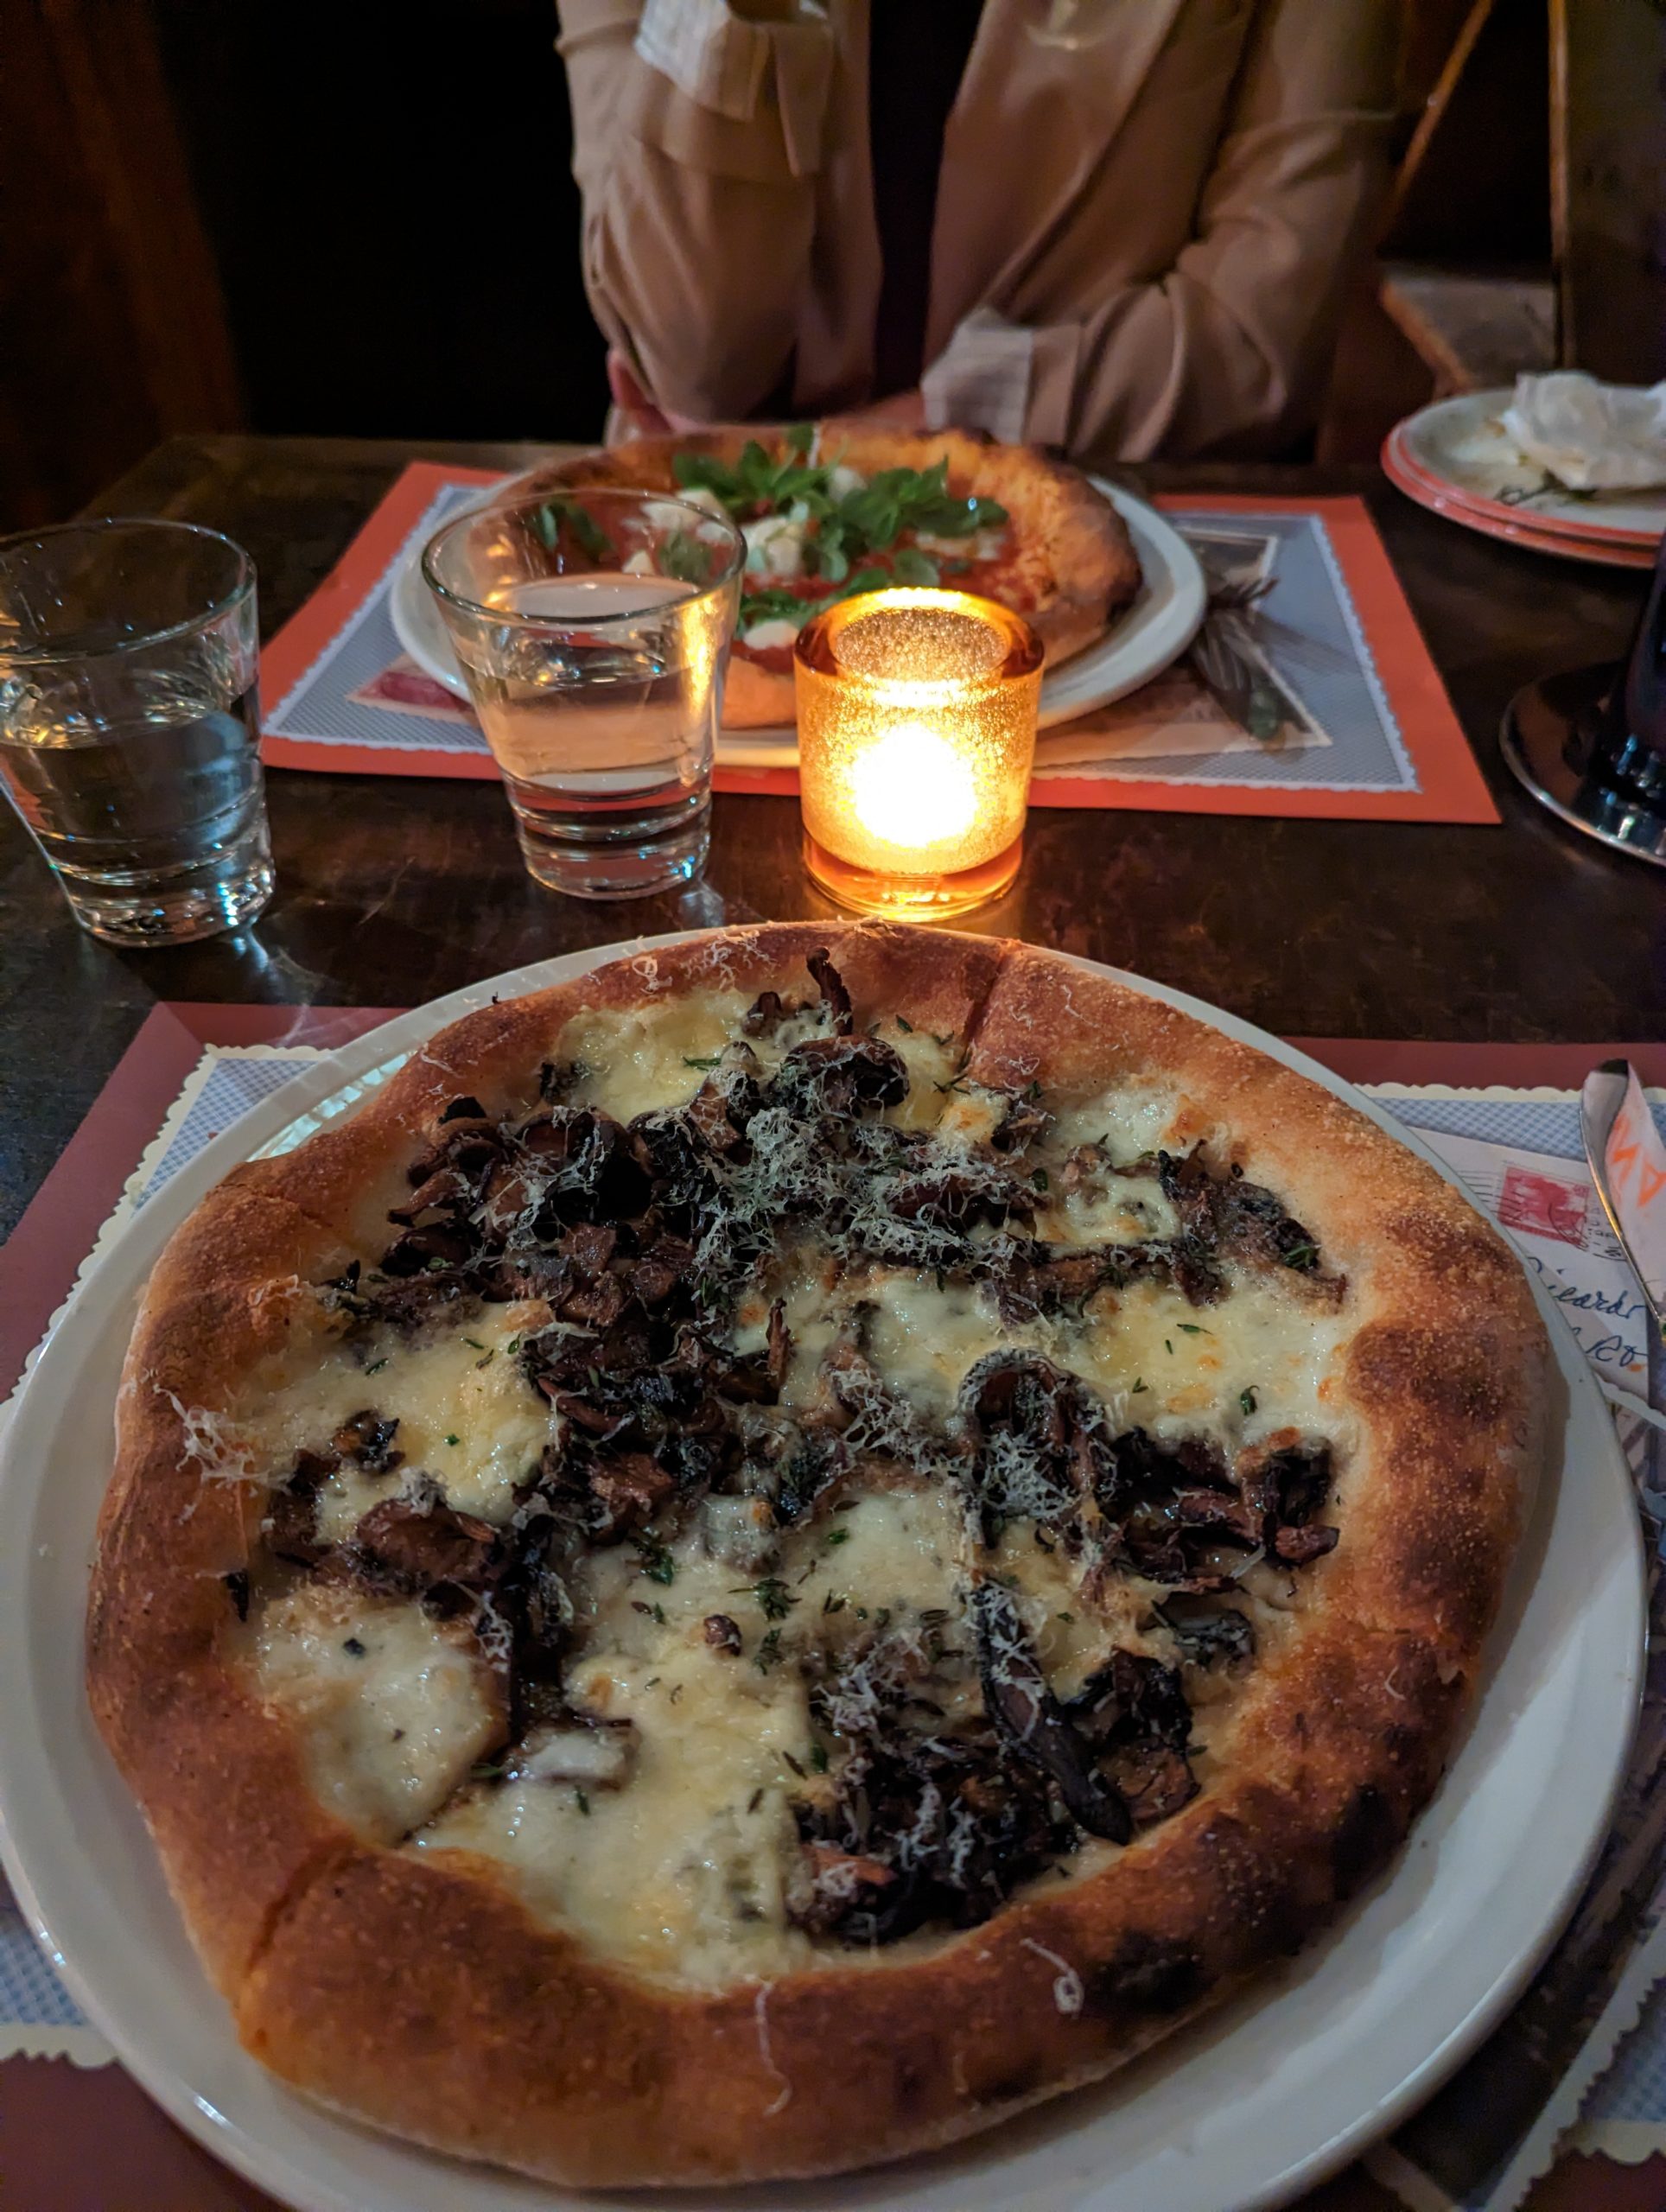
Set the stage: Puerto Rican Neapolitan pizza in San Juan a couple blocks from La Placita (popular nightlife area). Fidela sits on a side street surrounded by seemingly uninhabited buildings lined with beautiful street art & graffiti. Patrons hang out on the sidewalk as they wait to get a Fidela pie.
Pizzaiolo Ángel opened this cozy pizza shop in Santurce, originating as a local food truck. I didn’t have any notable pizza when I was last in PR almost a decade ago. The Neapolitan pizza game has since grown in popularity among the Boricua. As much as I love the local cuisine, I was especially excited for this pizza. Unsurprisingly, Fidela did not disappoint.
Talk about popular – we arrived at 9pm on a Wednesday night (an hour before close), and the restaurant was packed. The menu is simple: a couple apps, a few pies and libations. We opted for the baseline Margherita, and another pie with burrata. I’m a sucker for burrata.
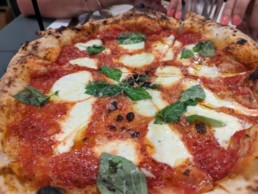
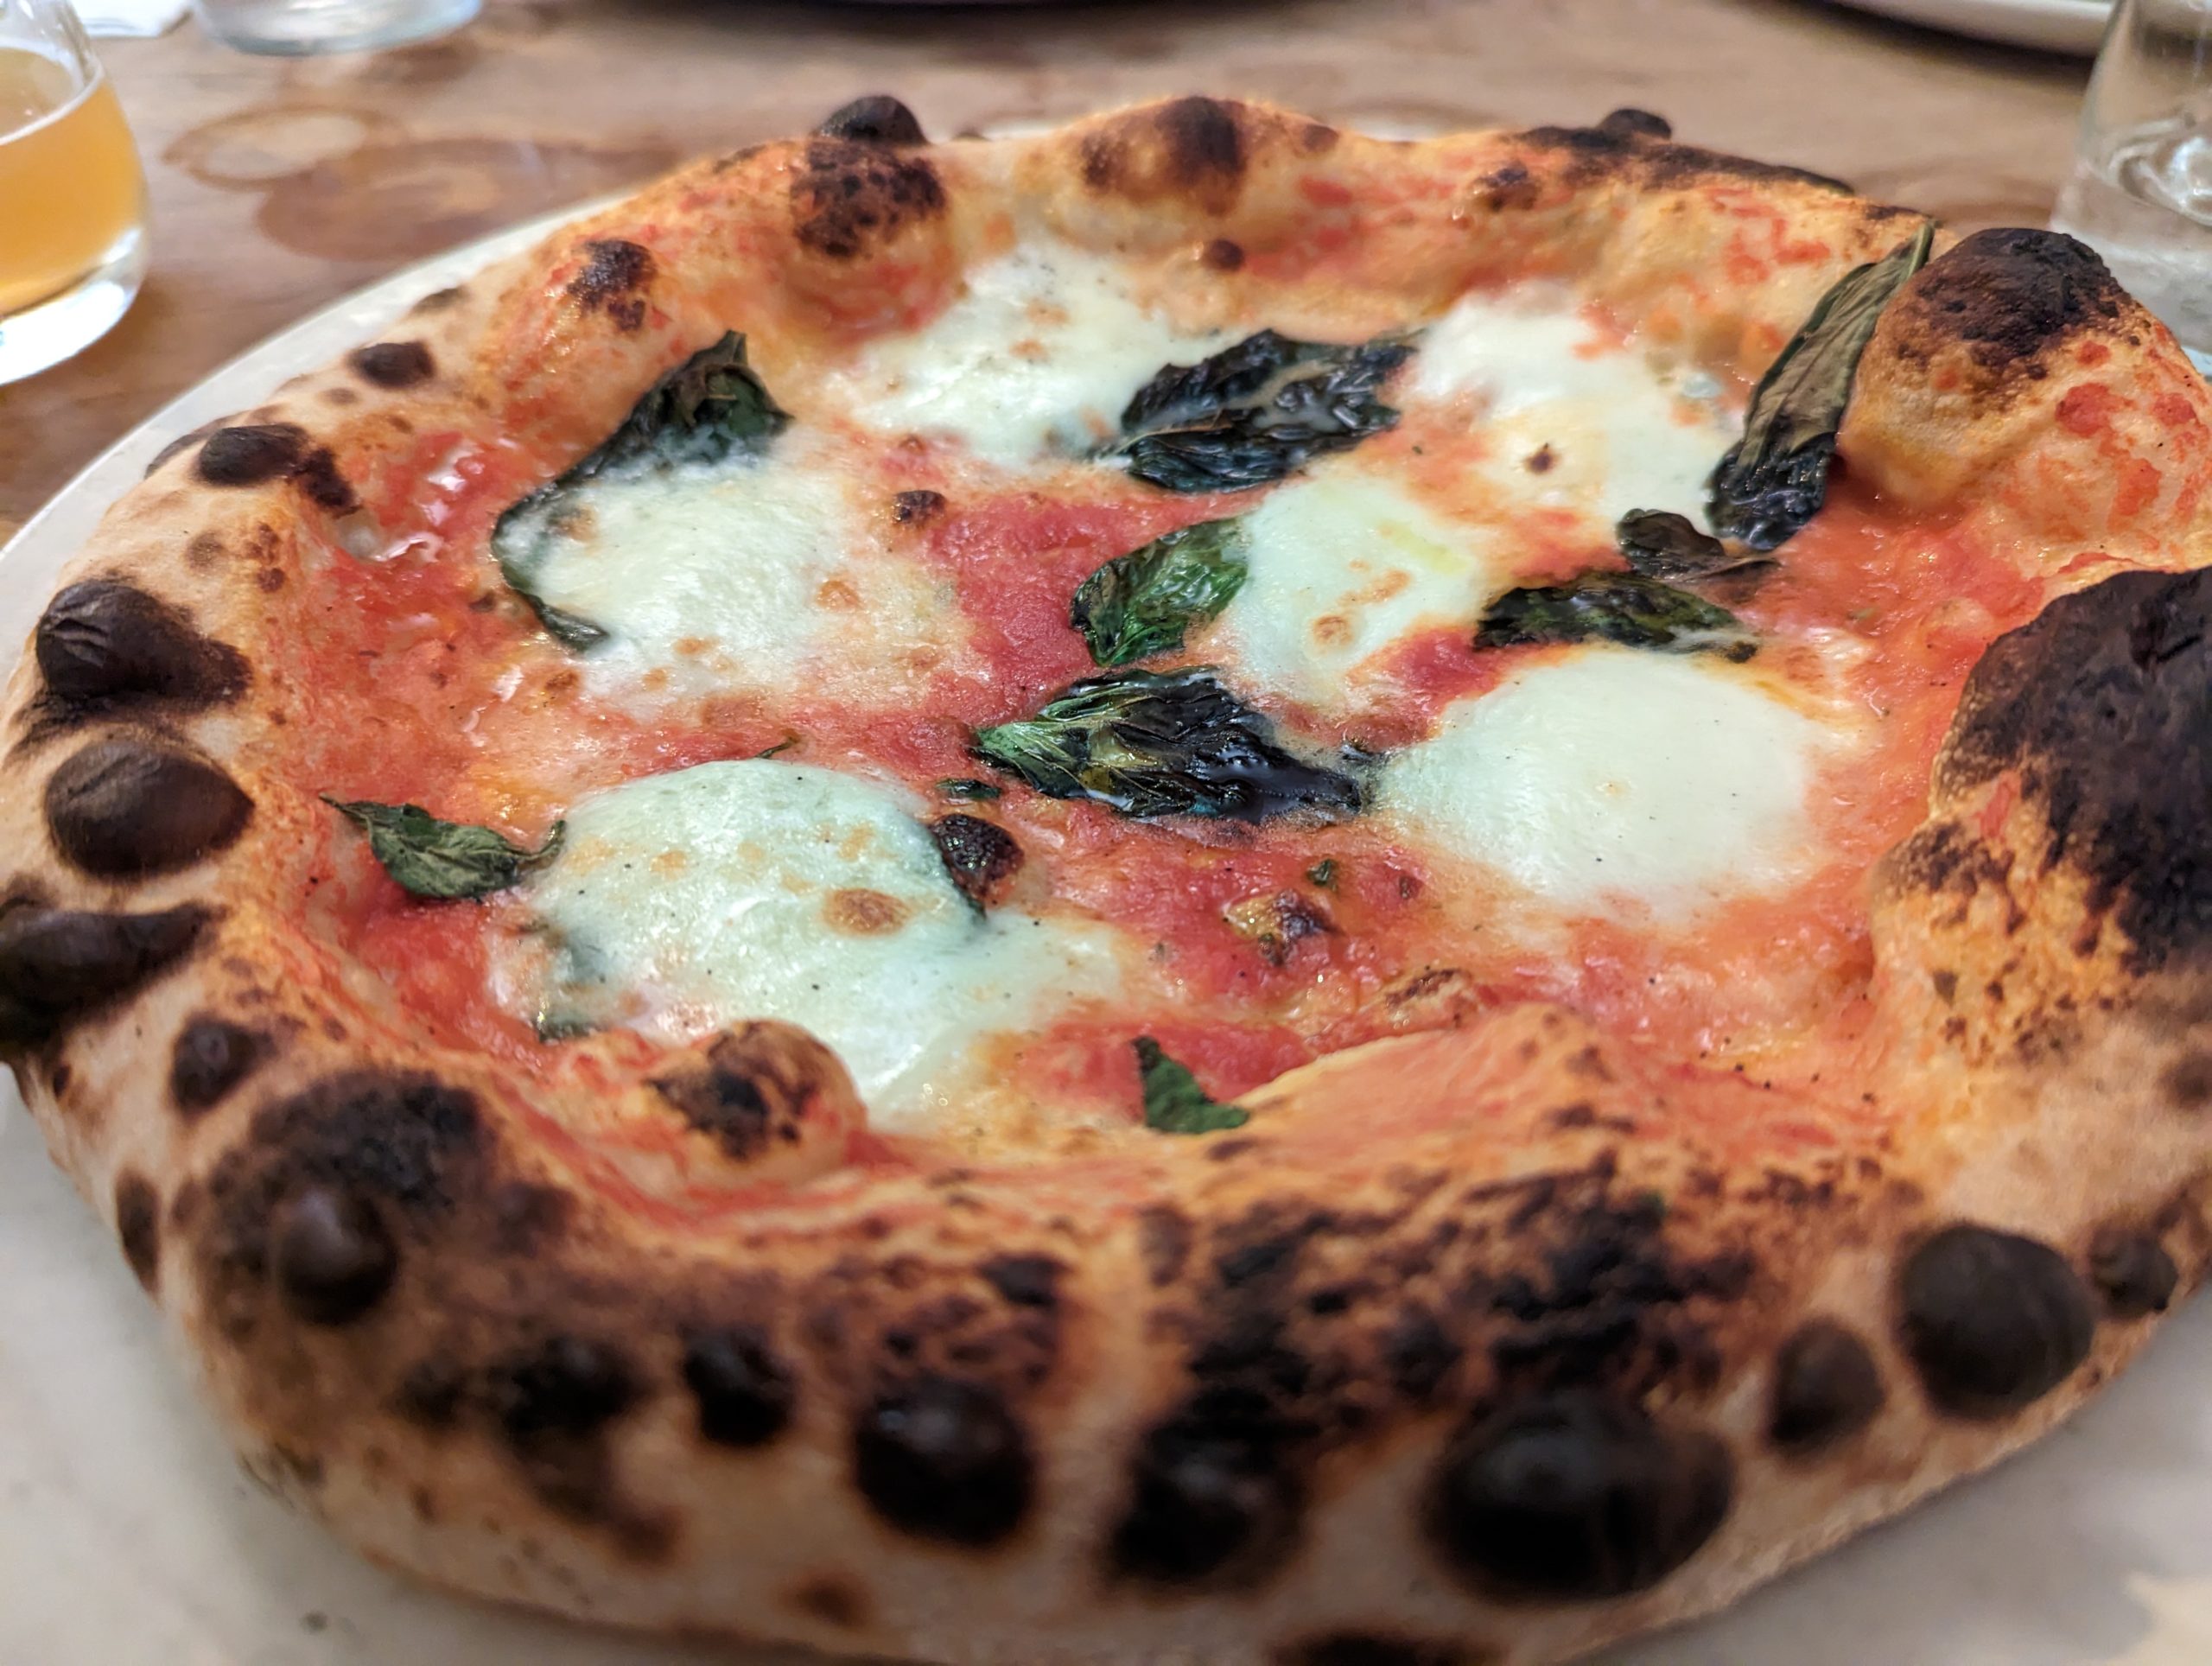
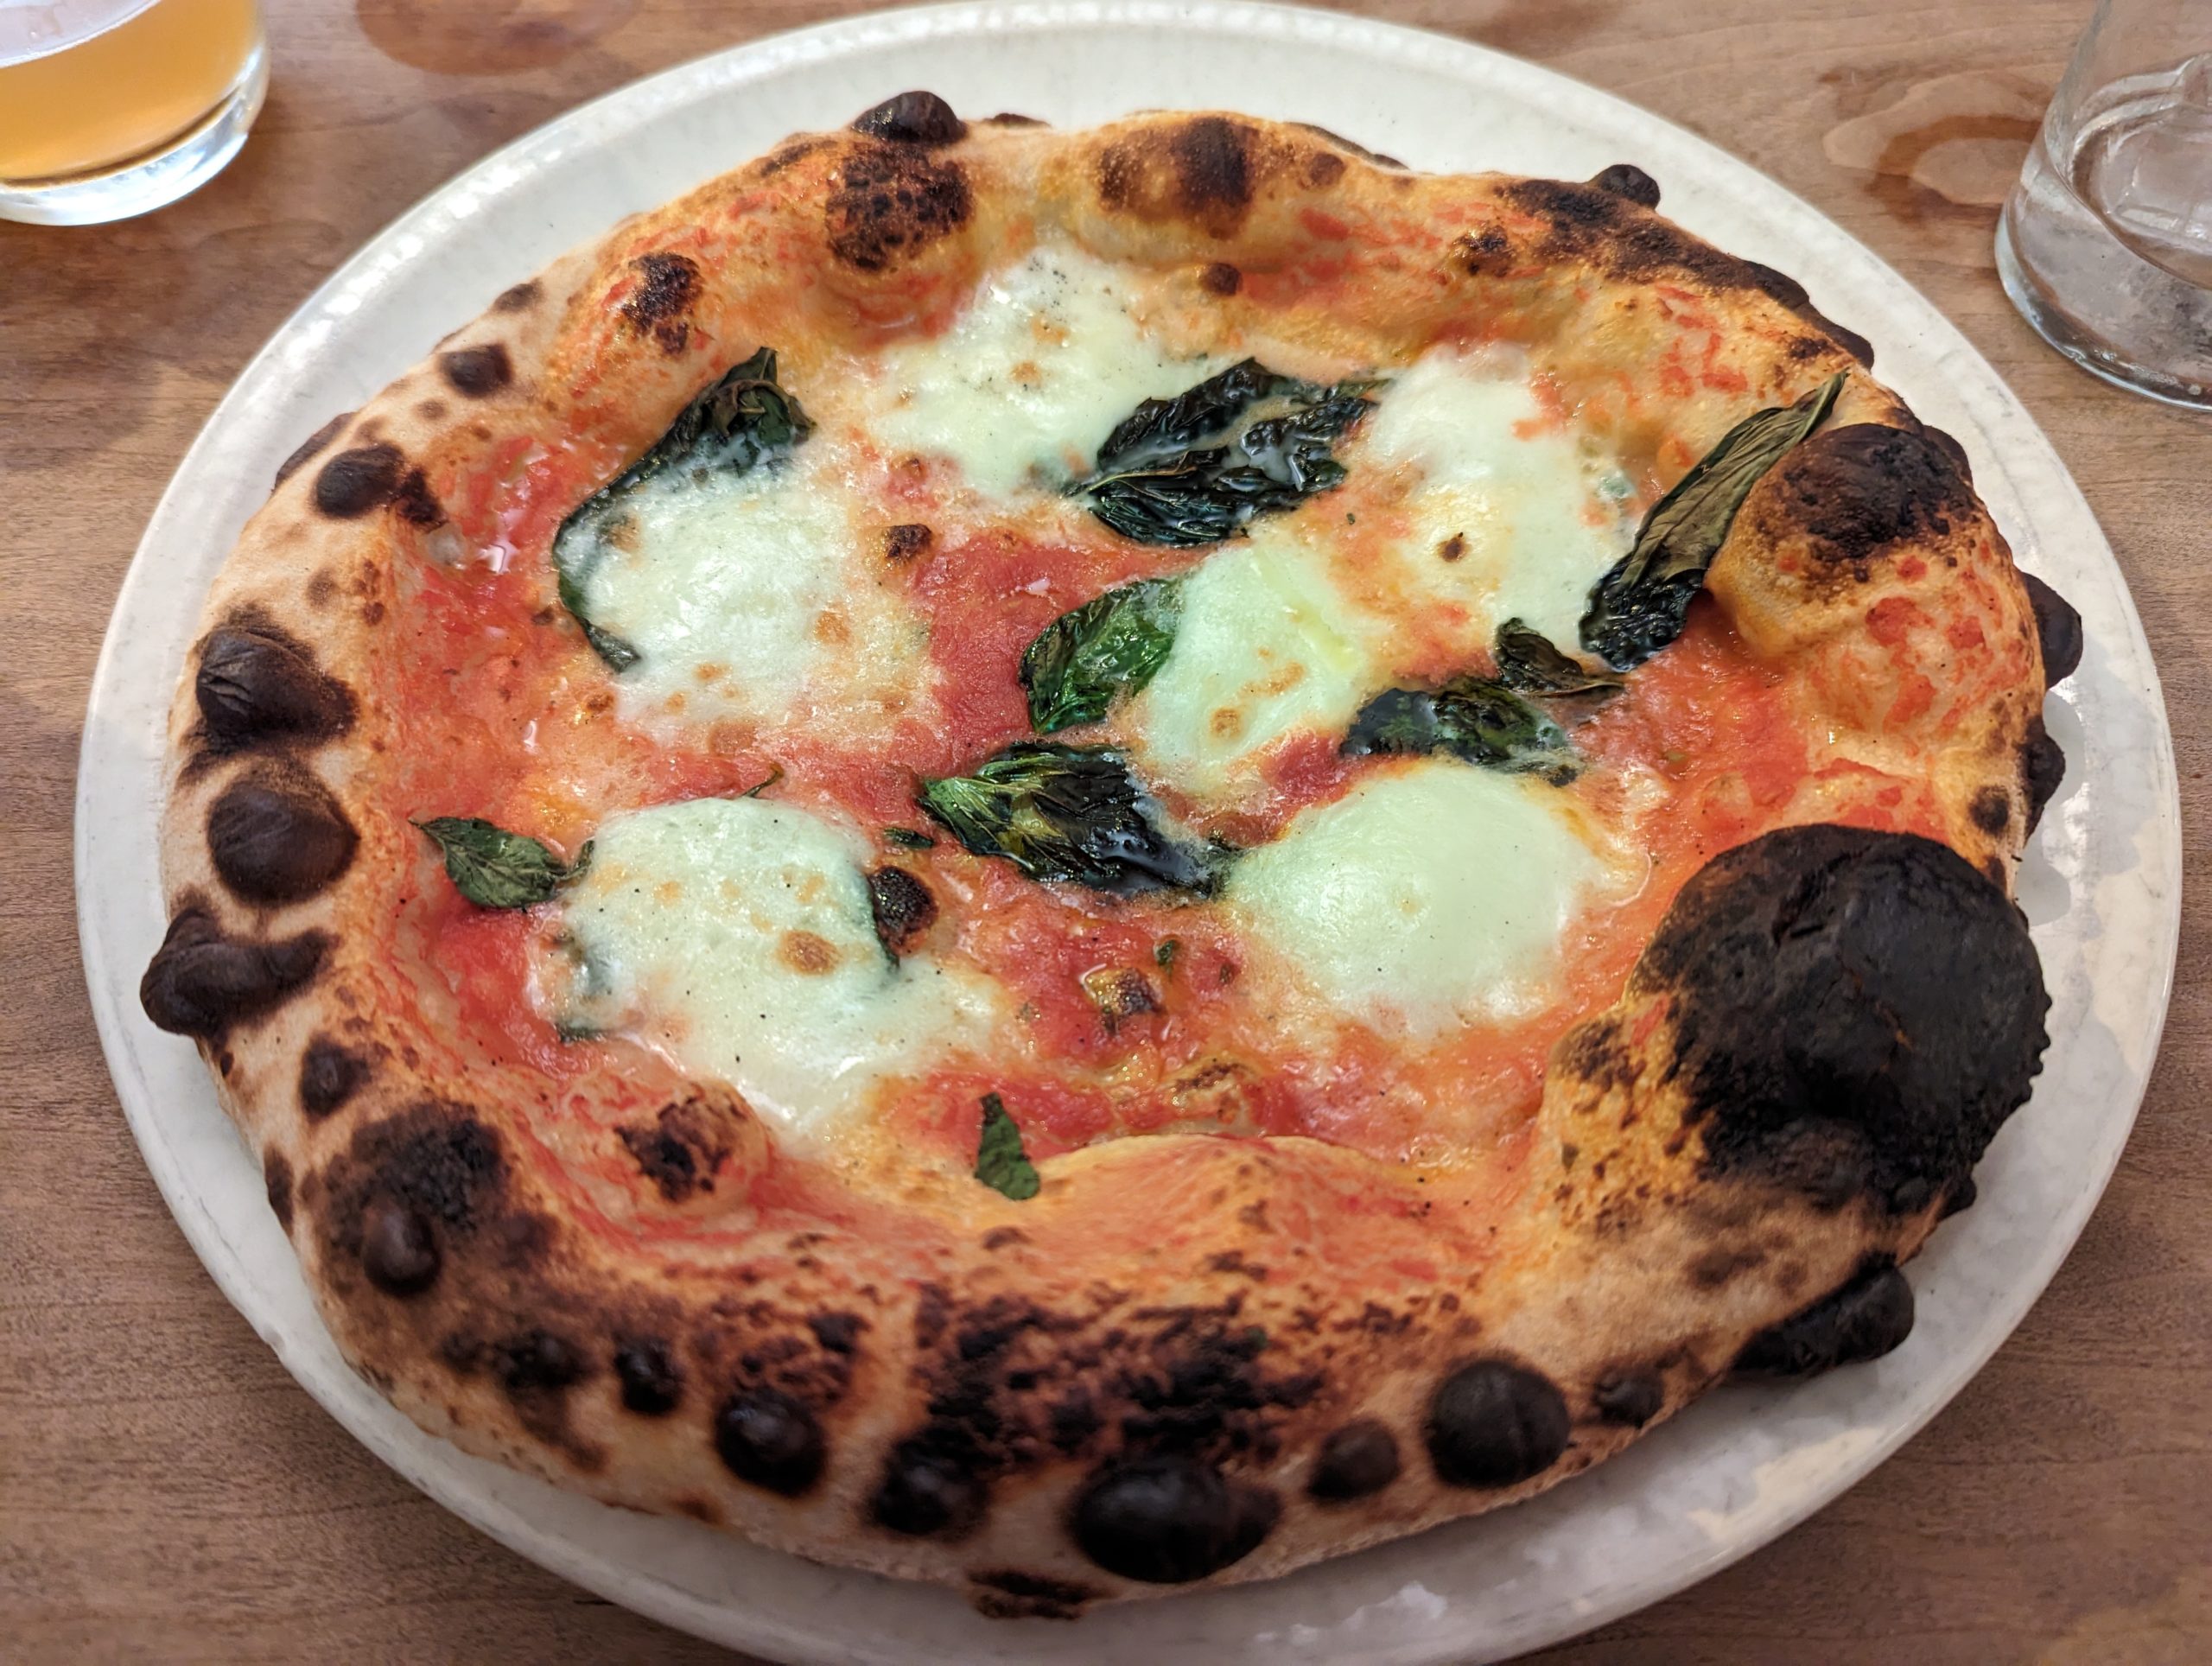
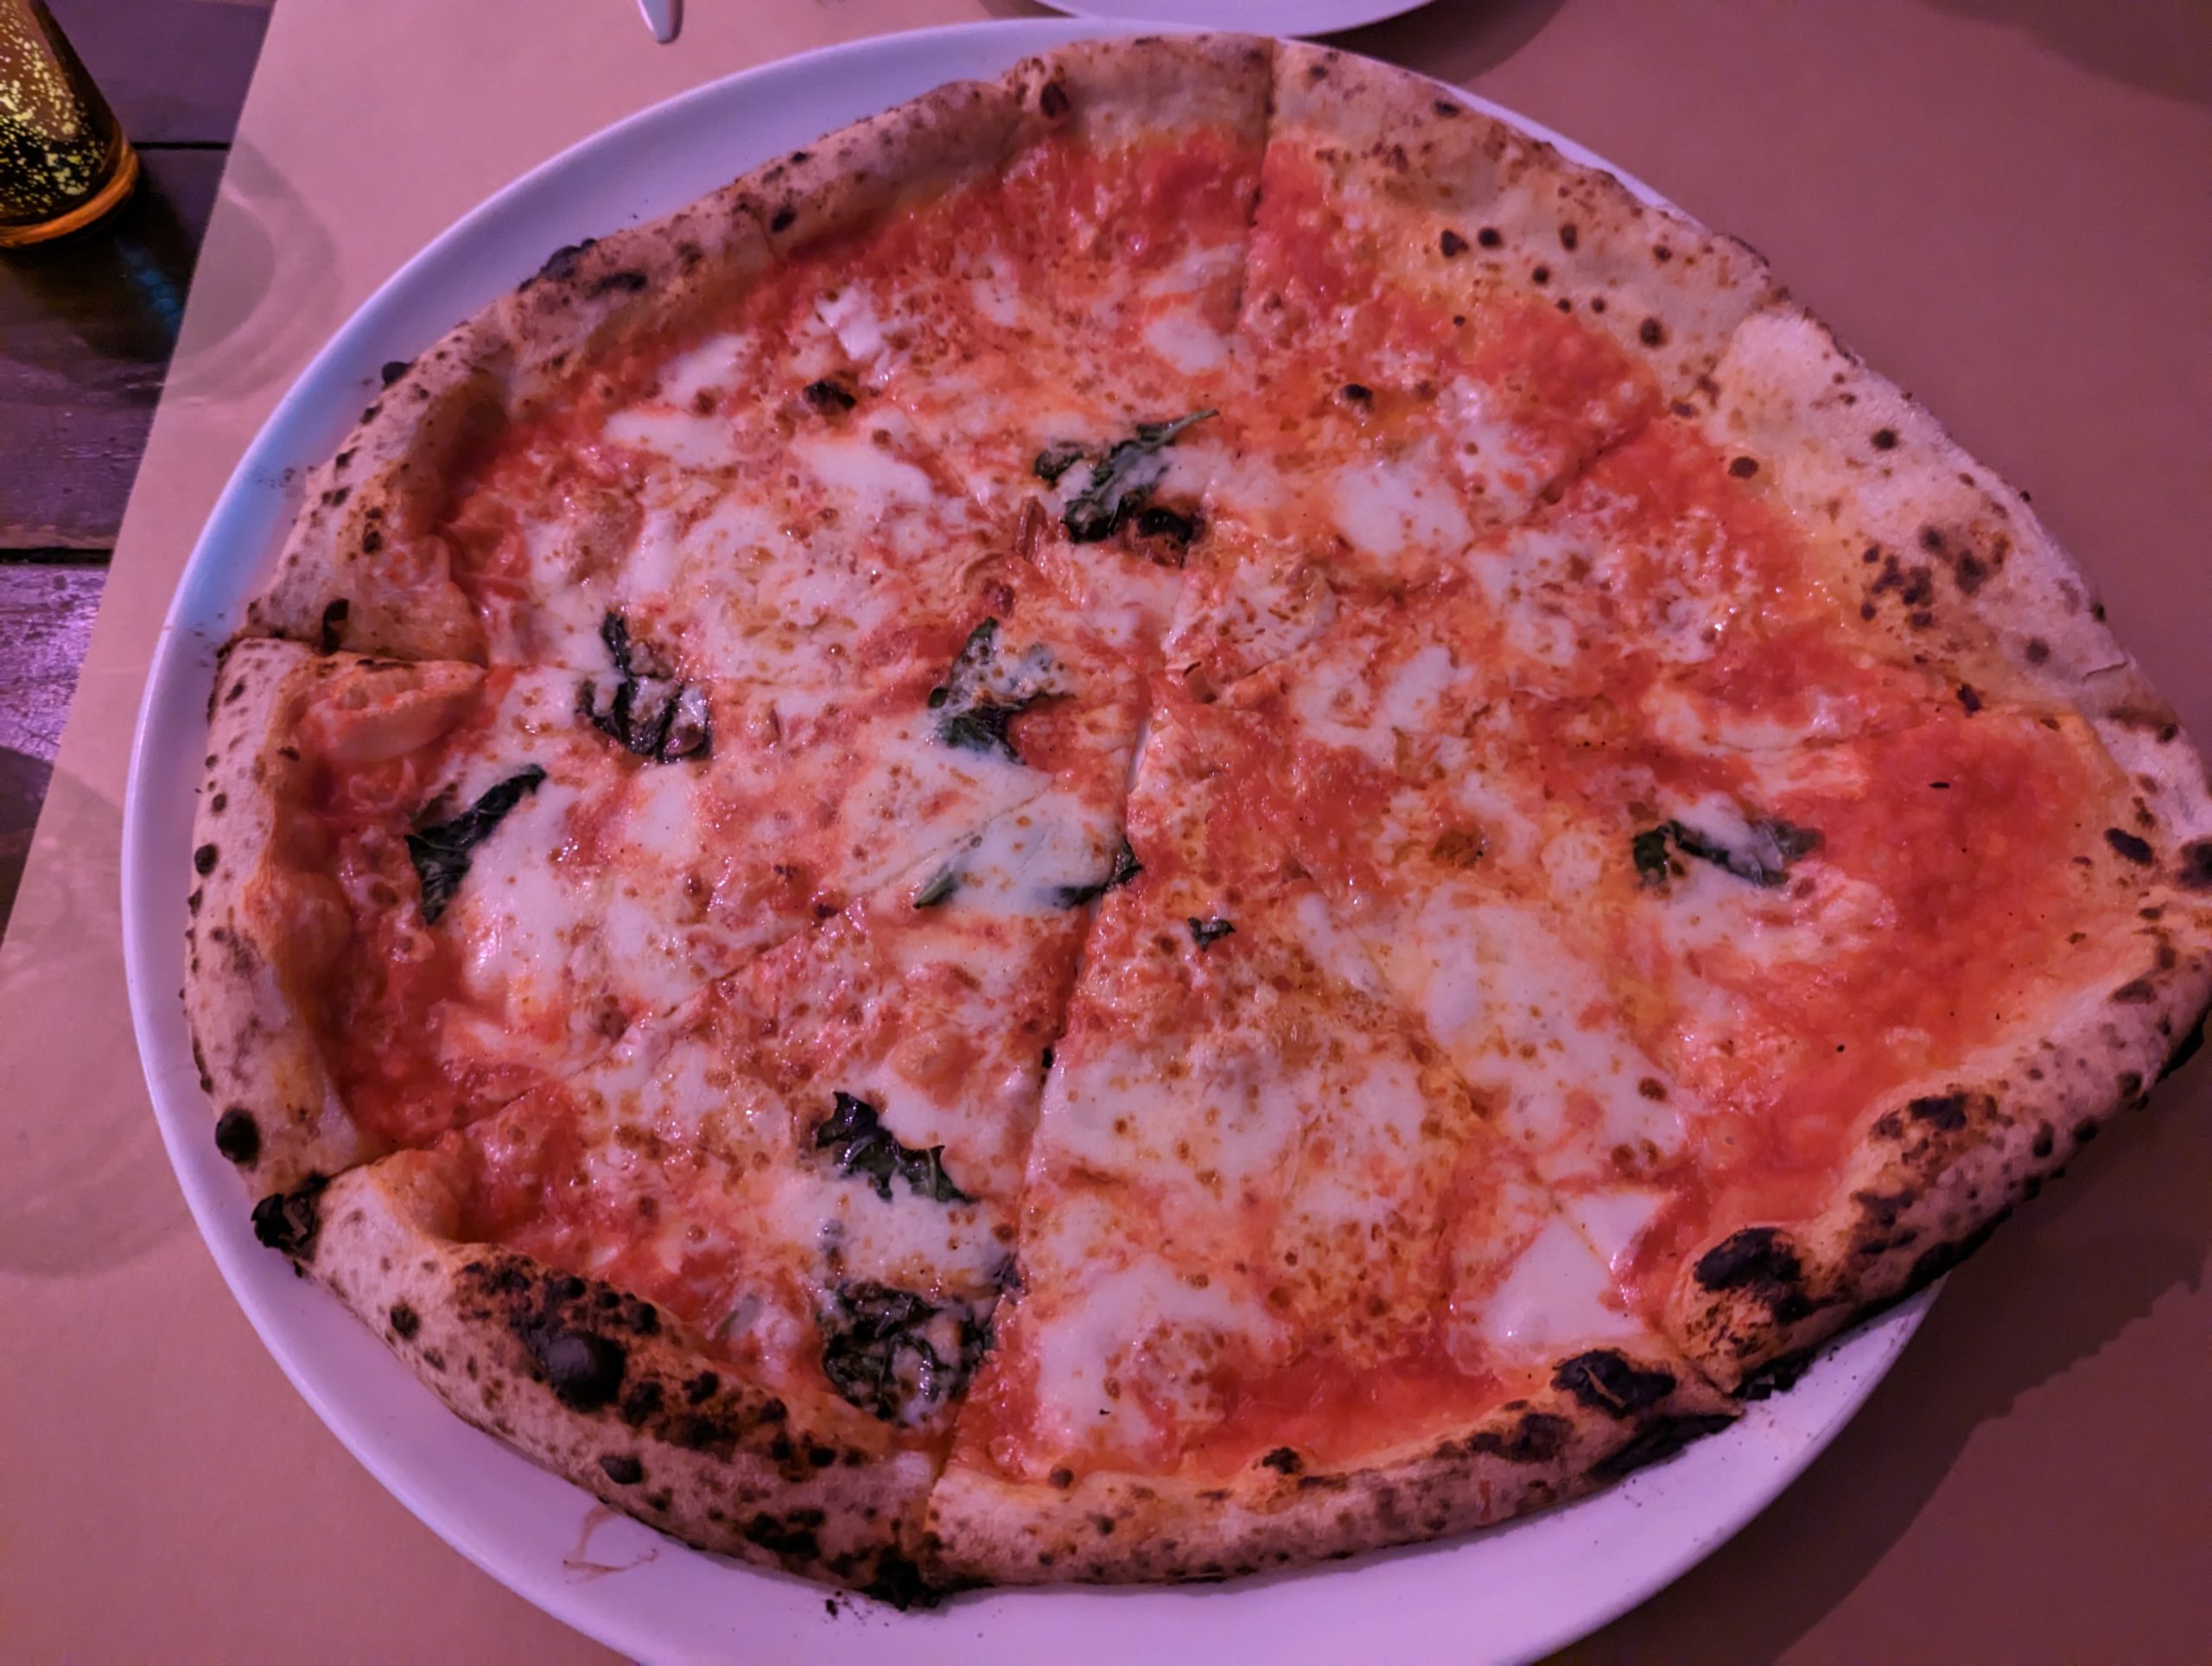
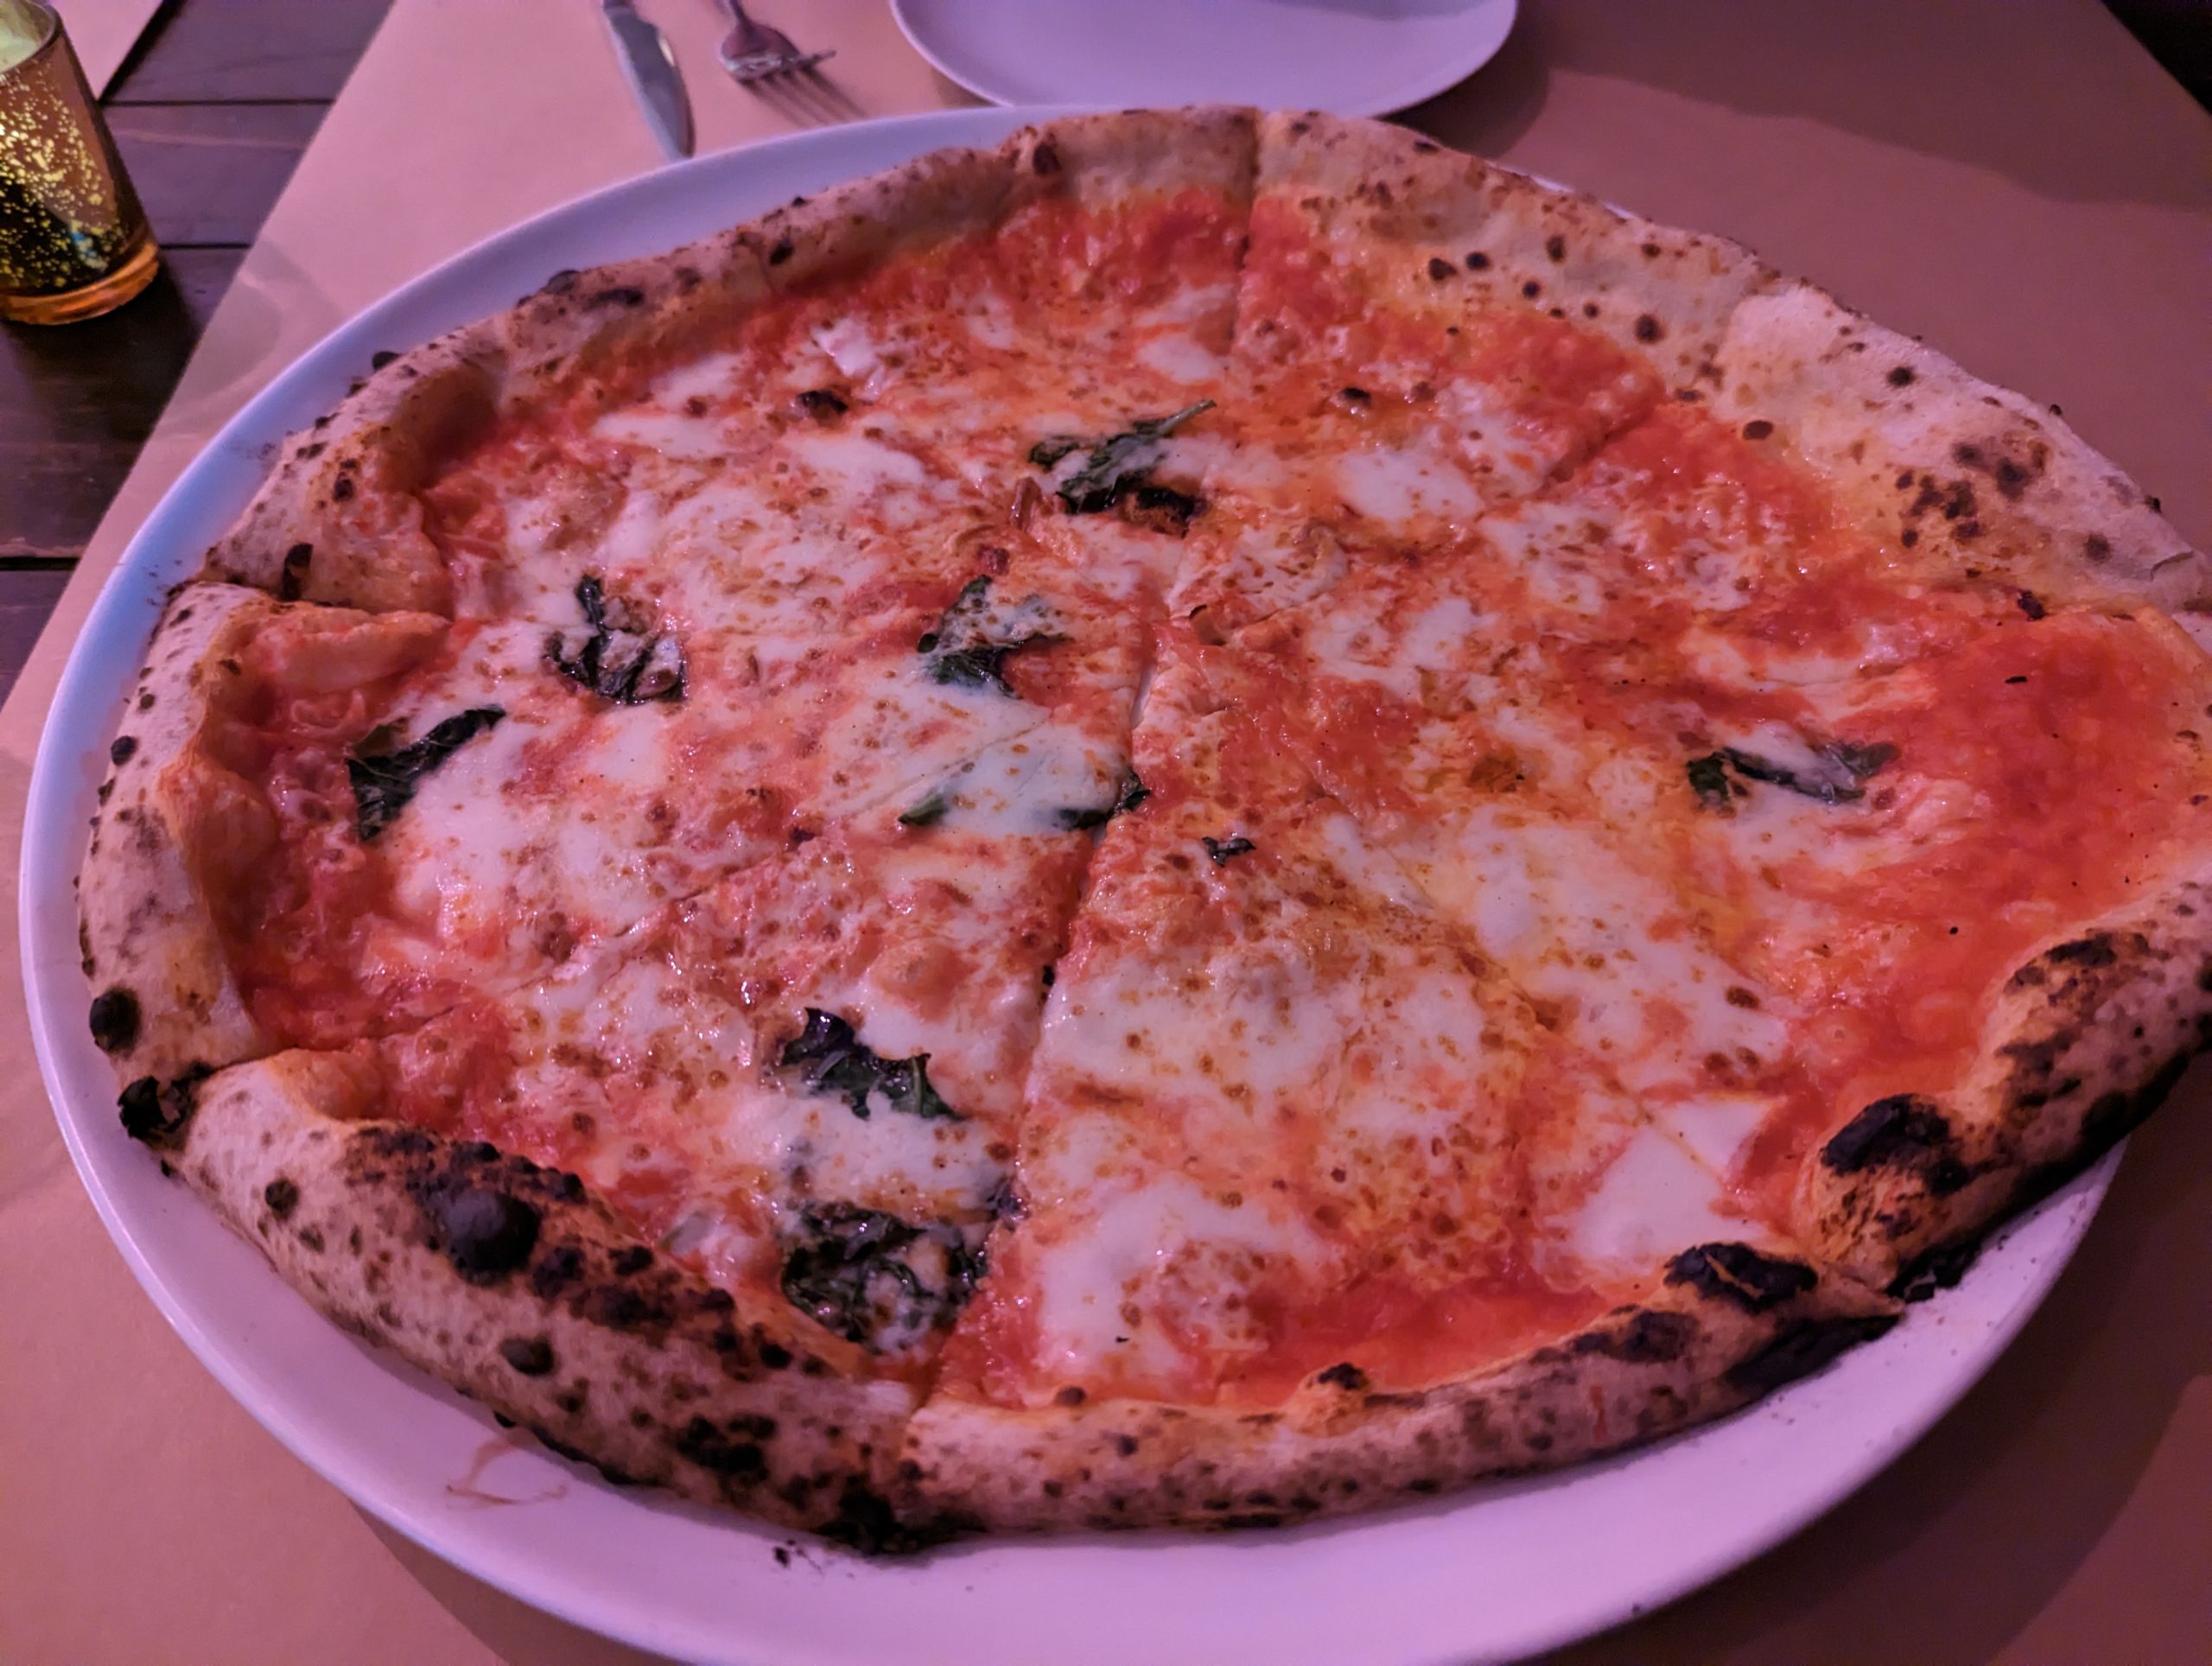
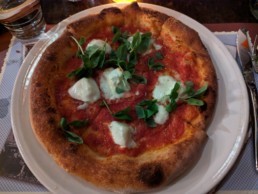
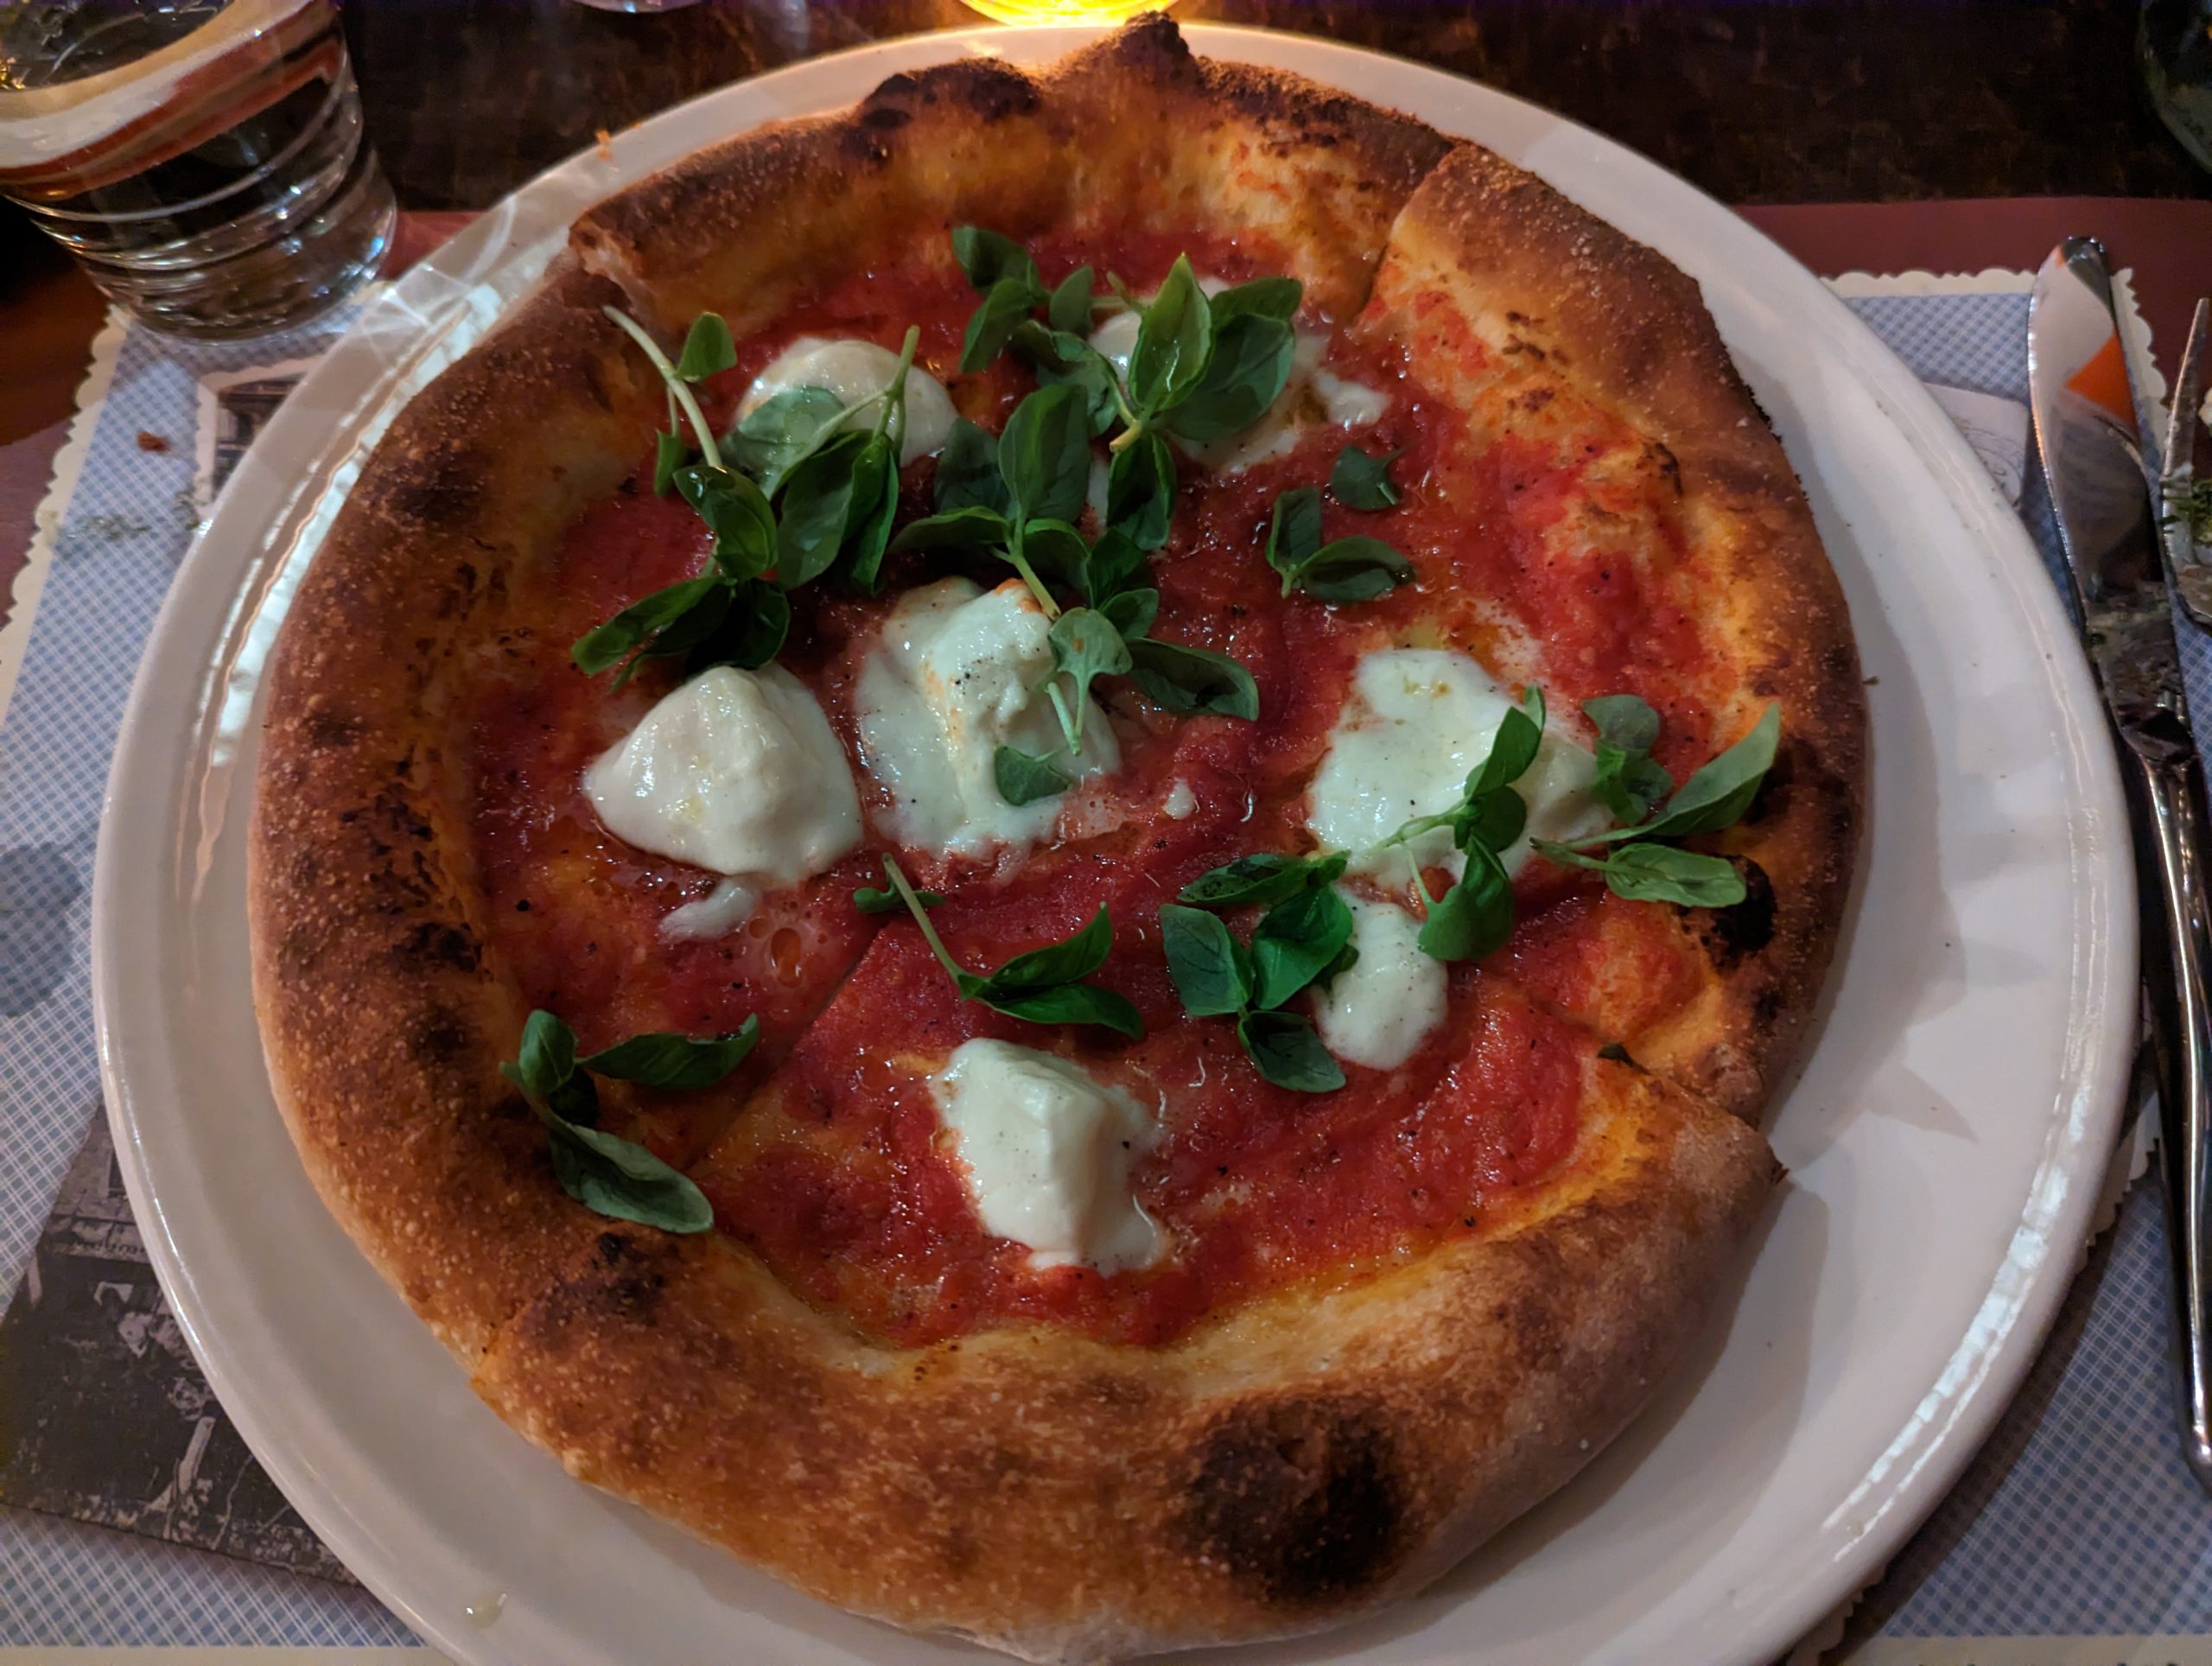
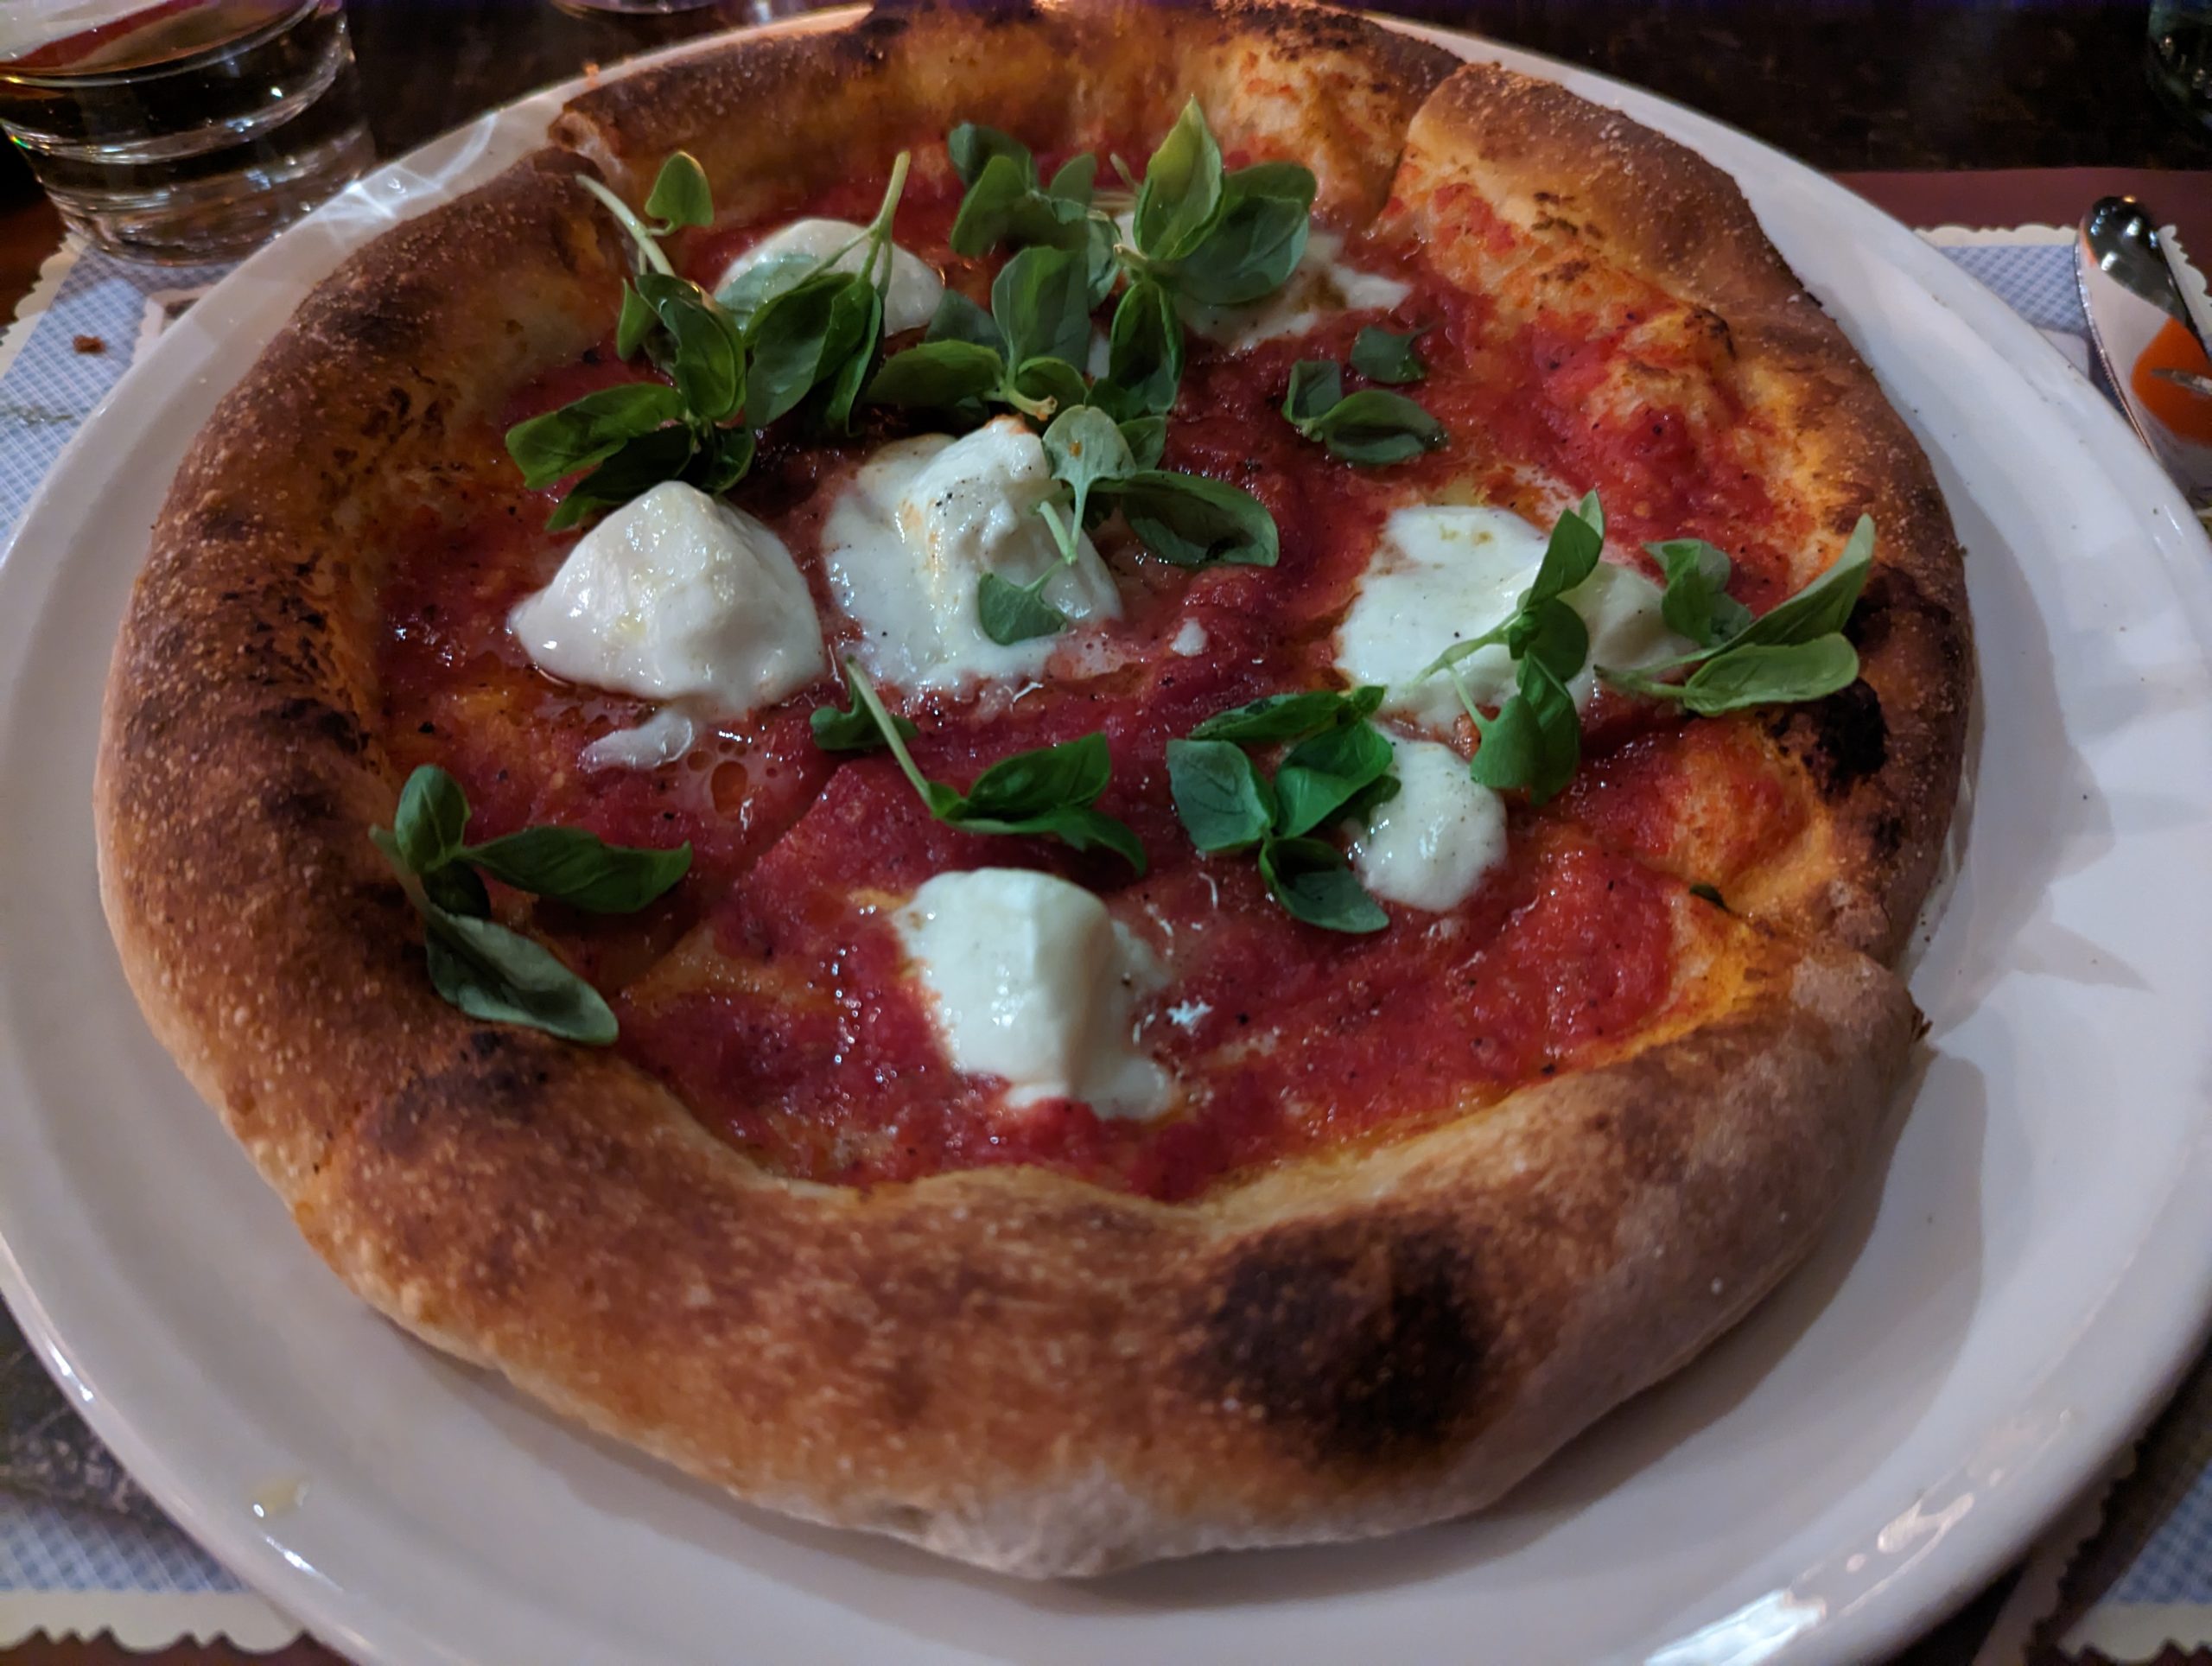
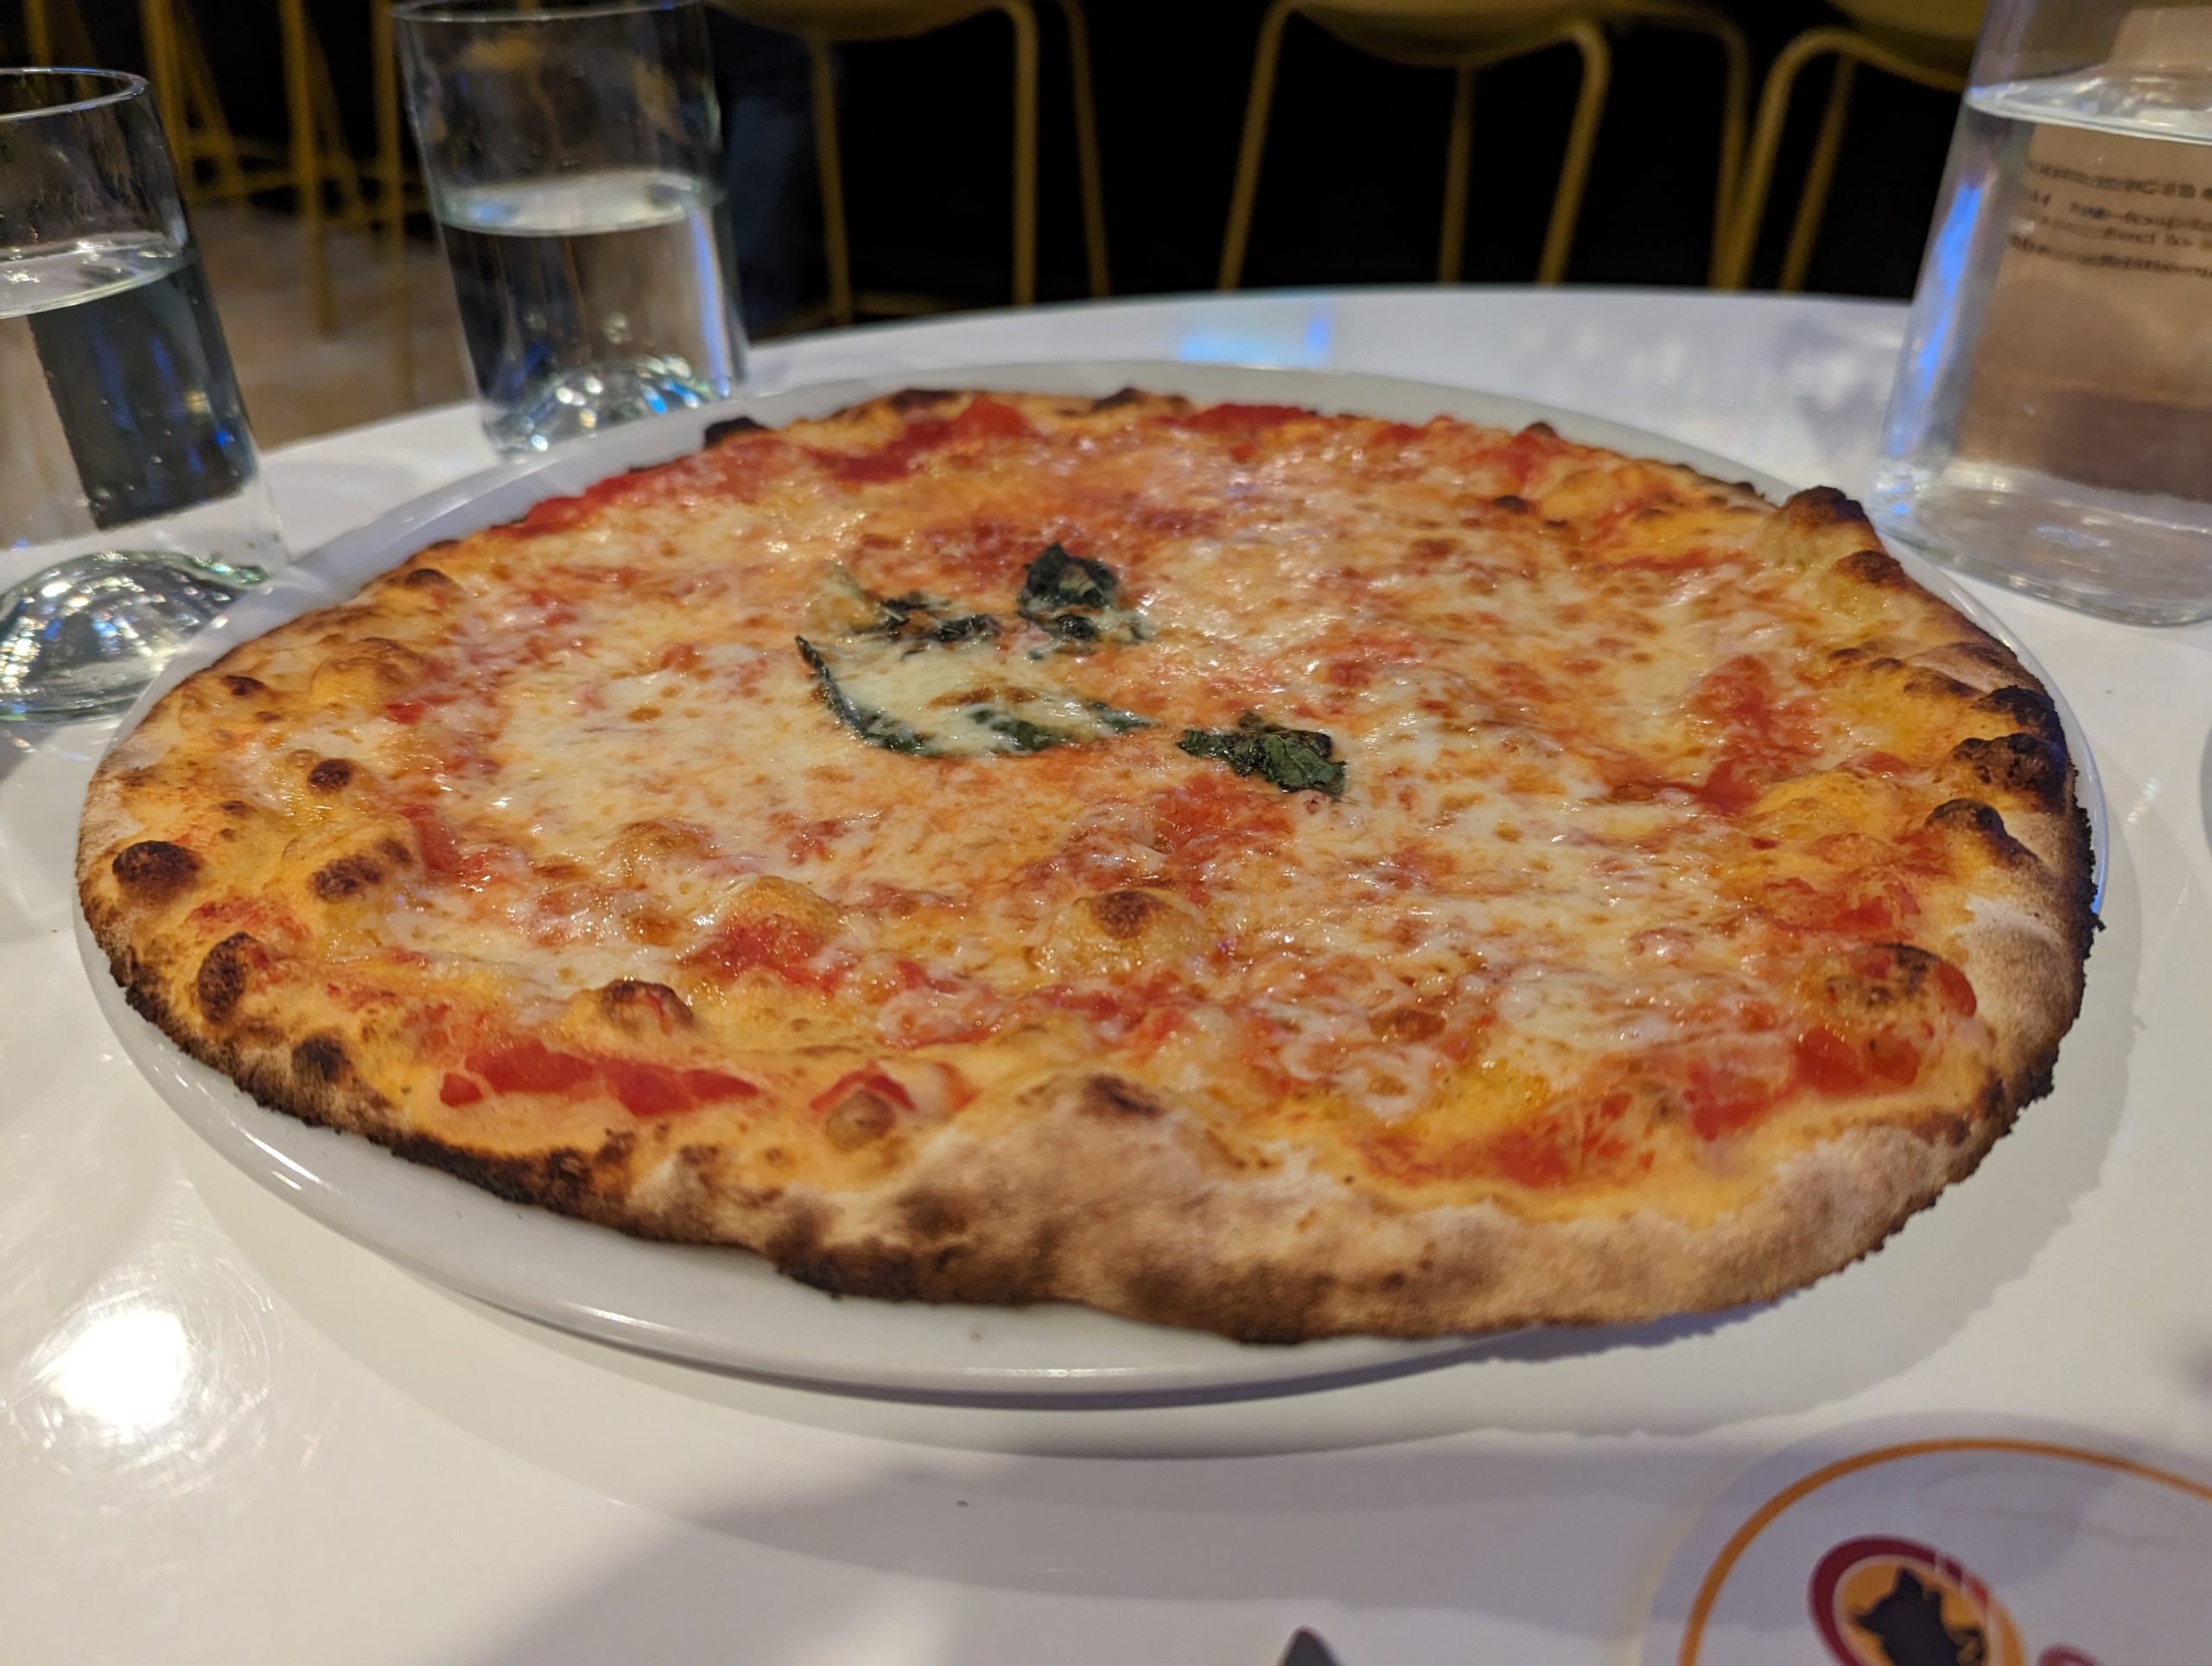
Margarita
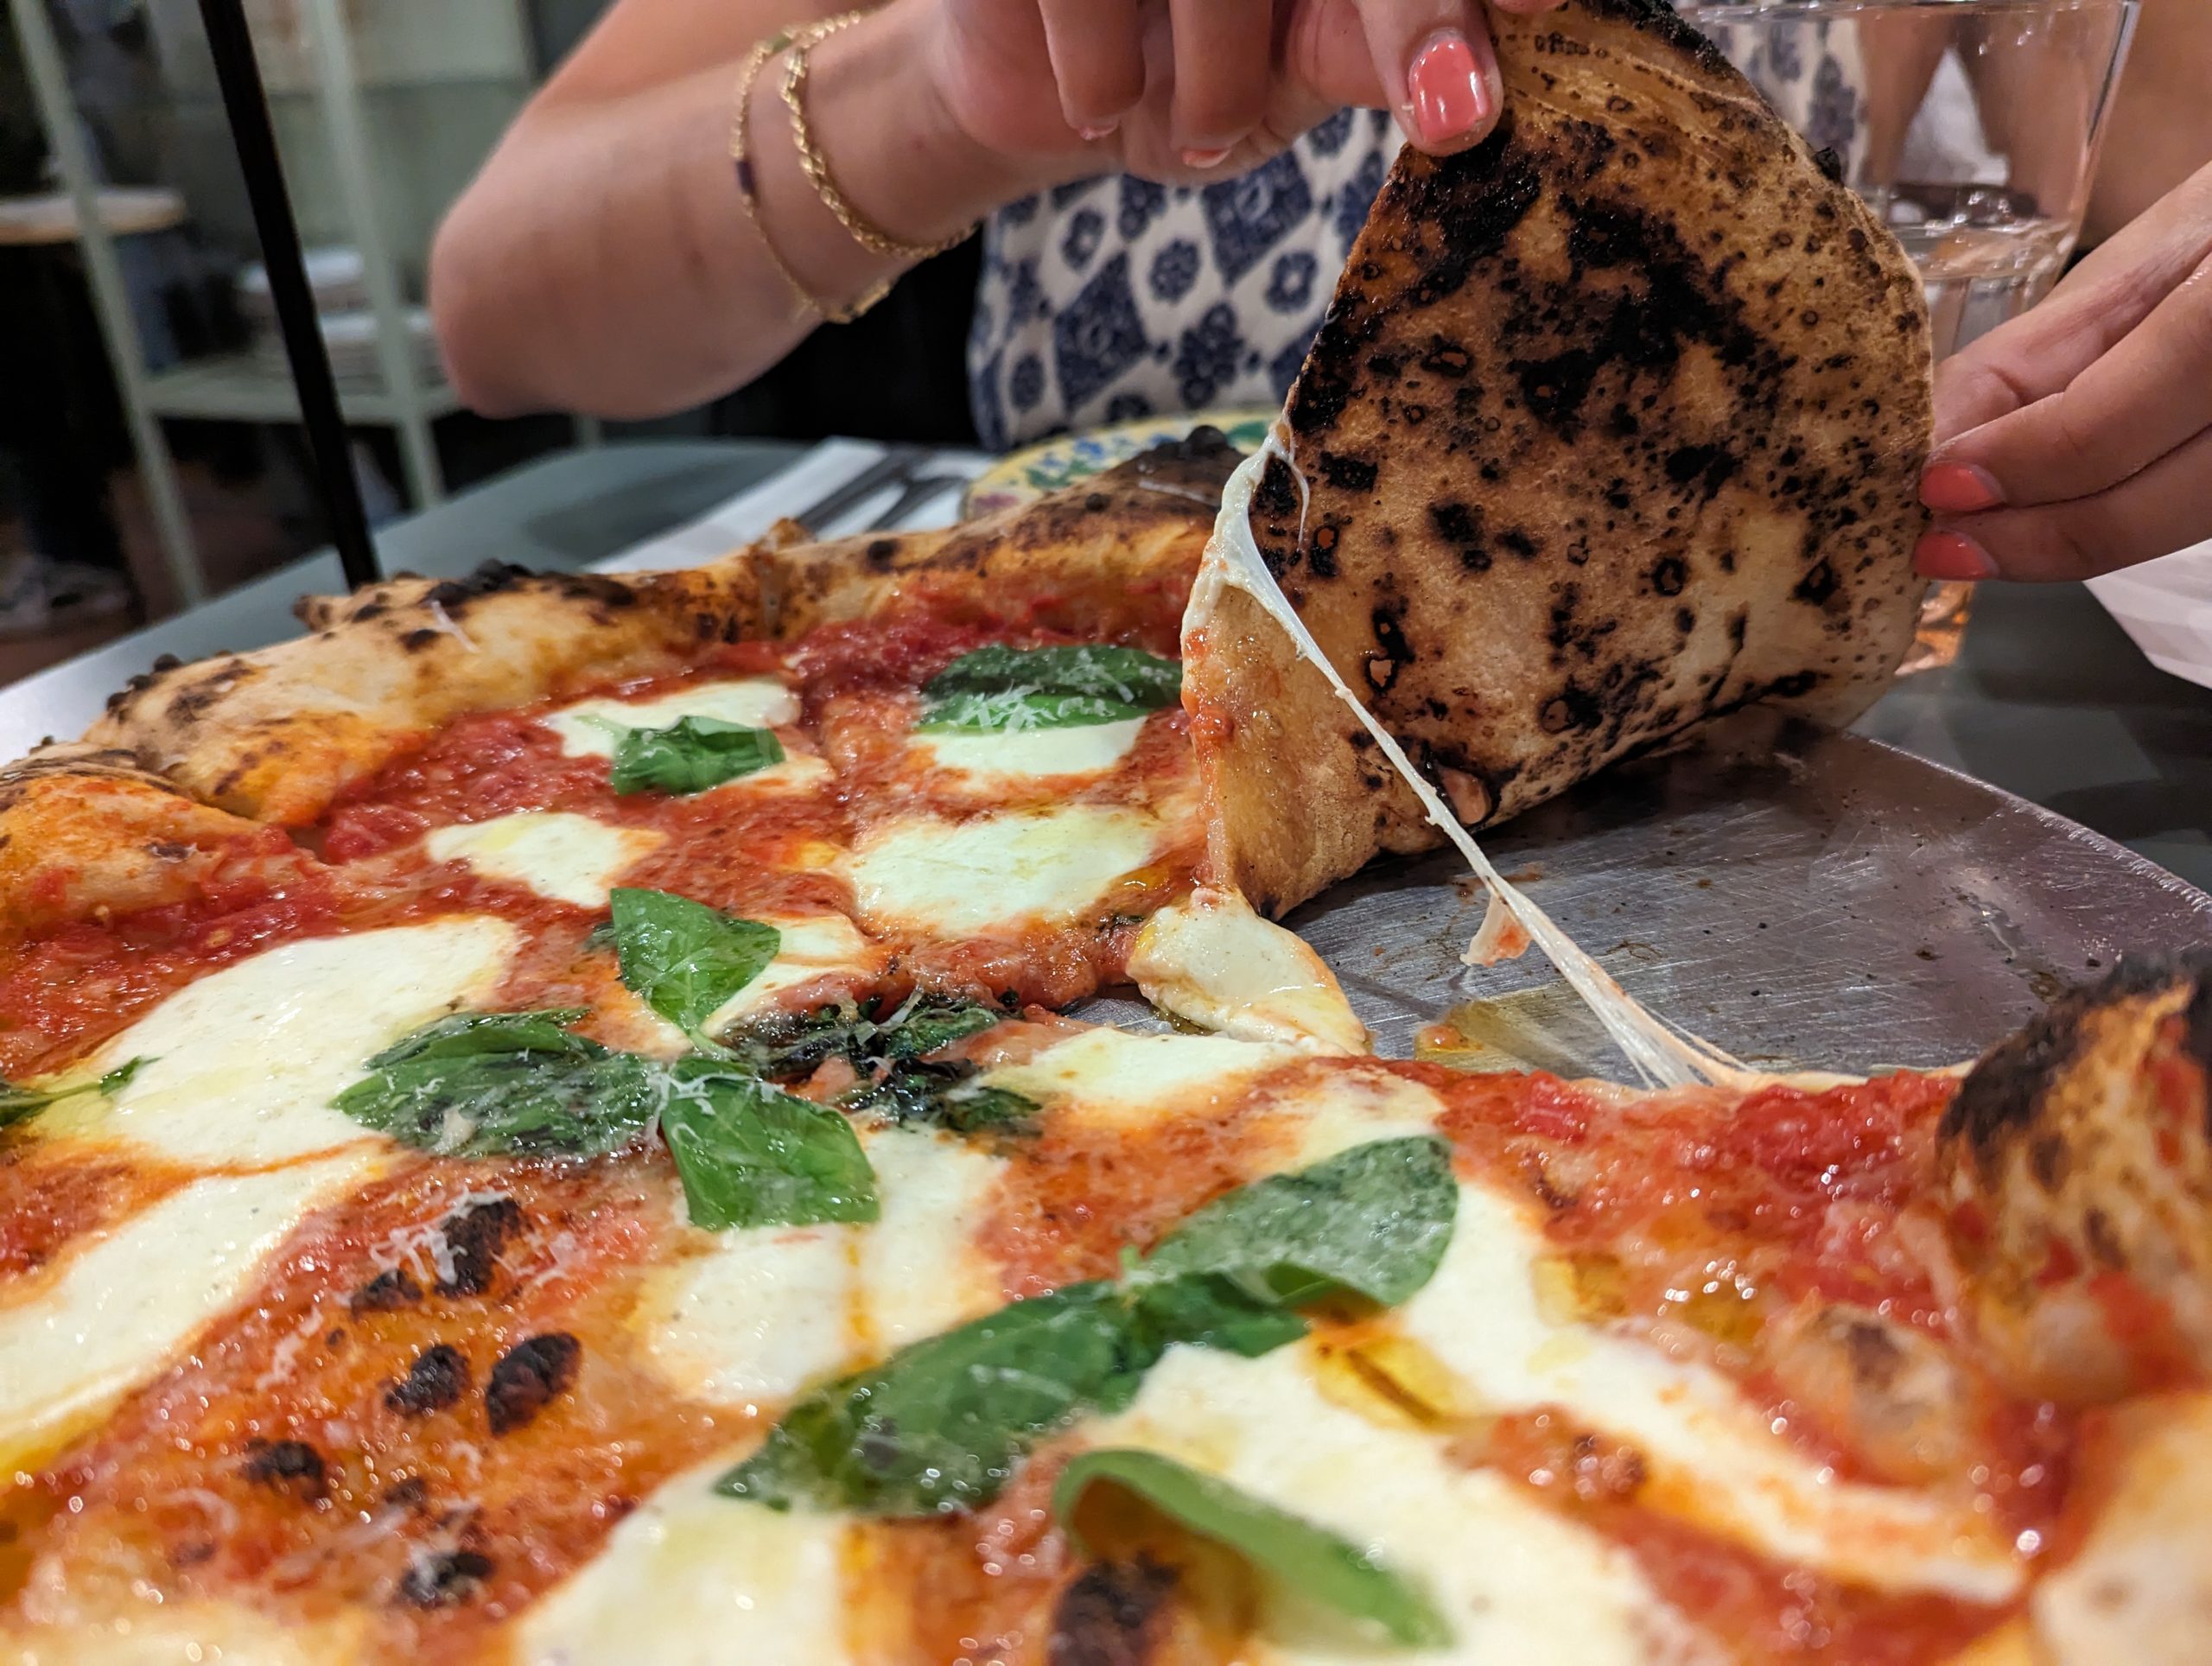
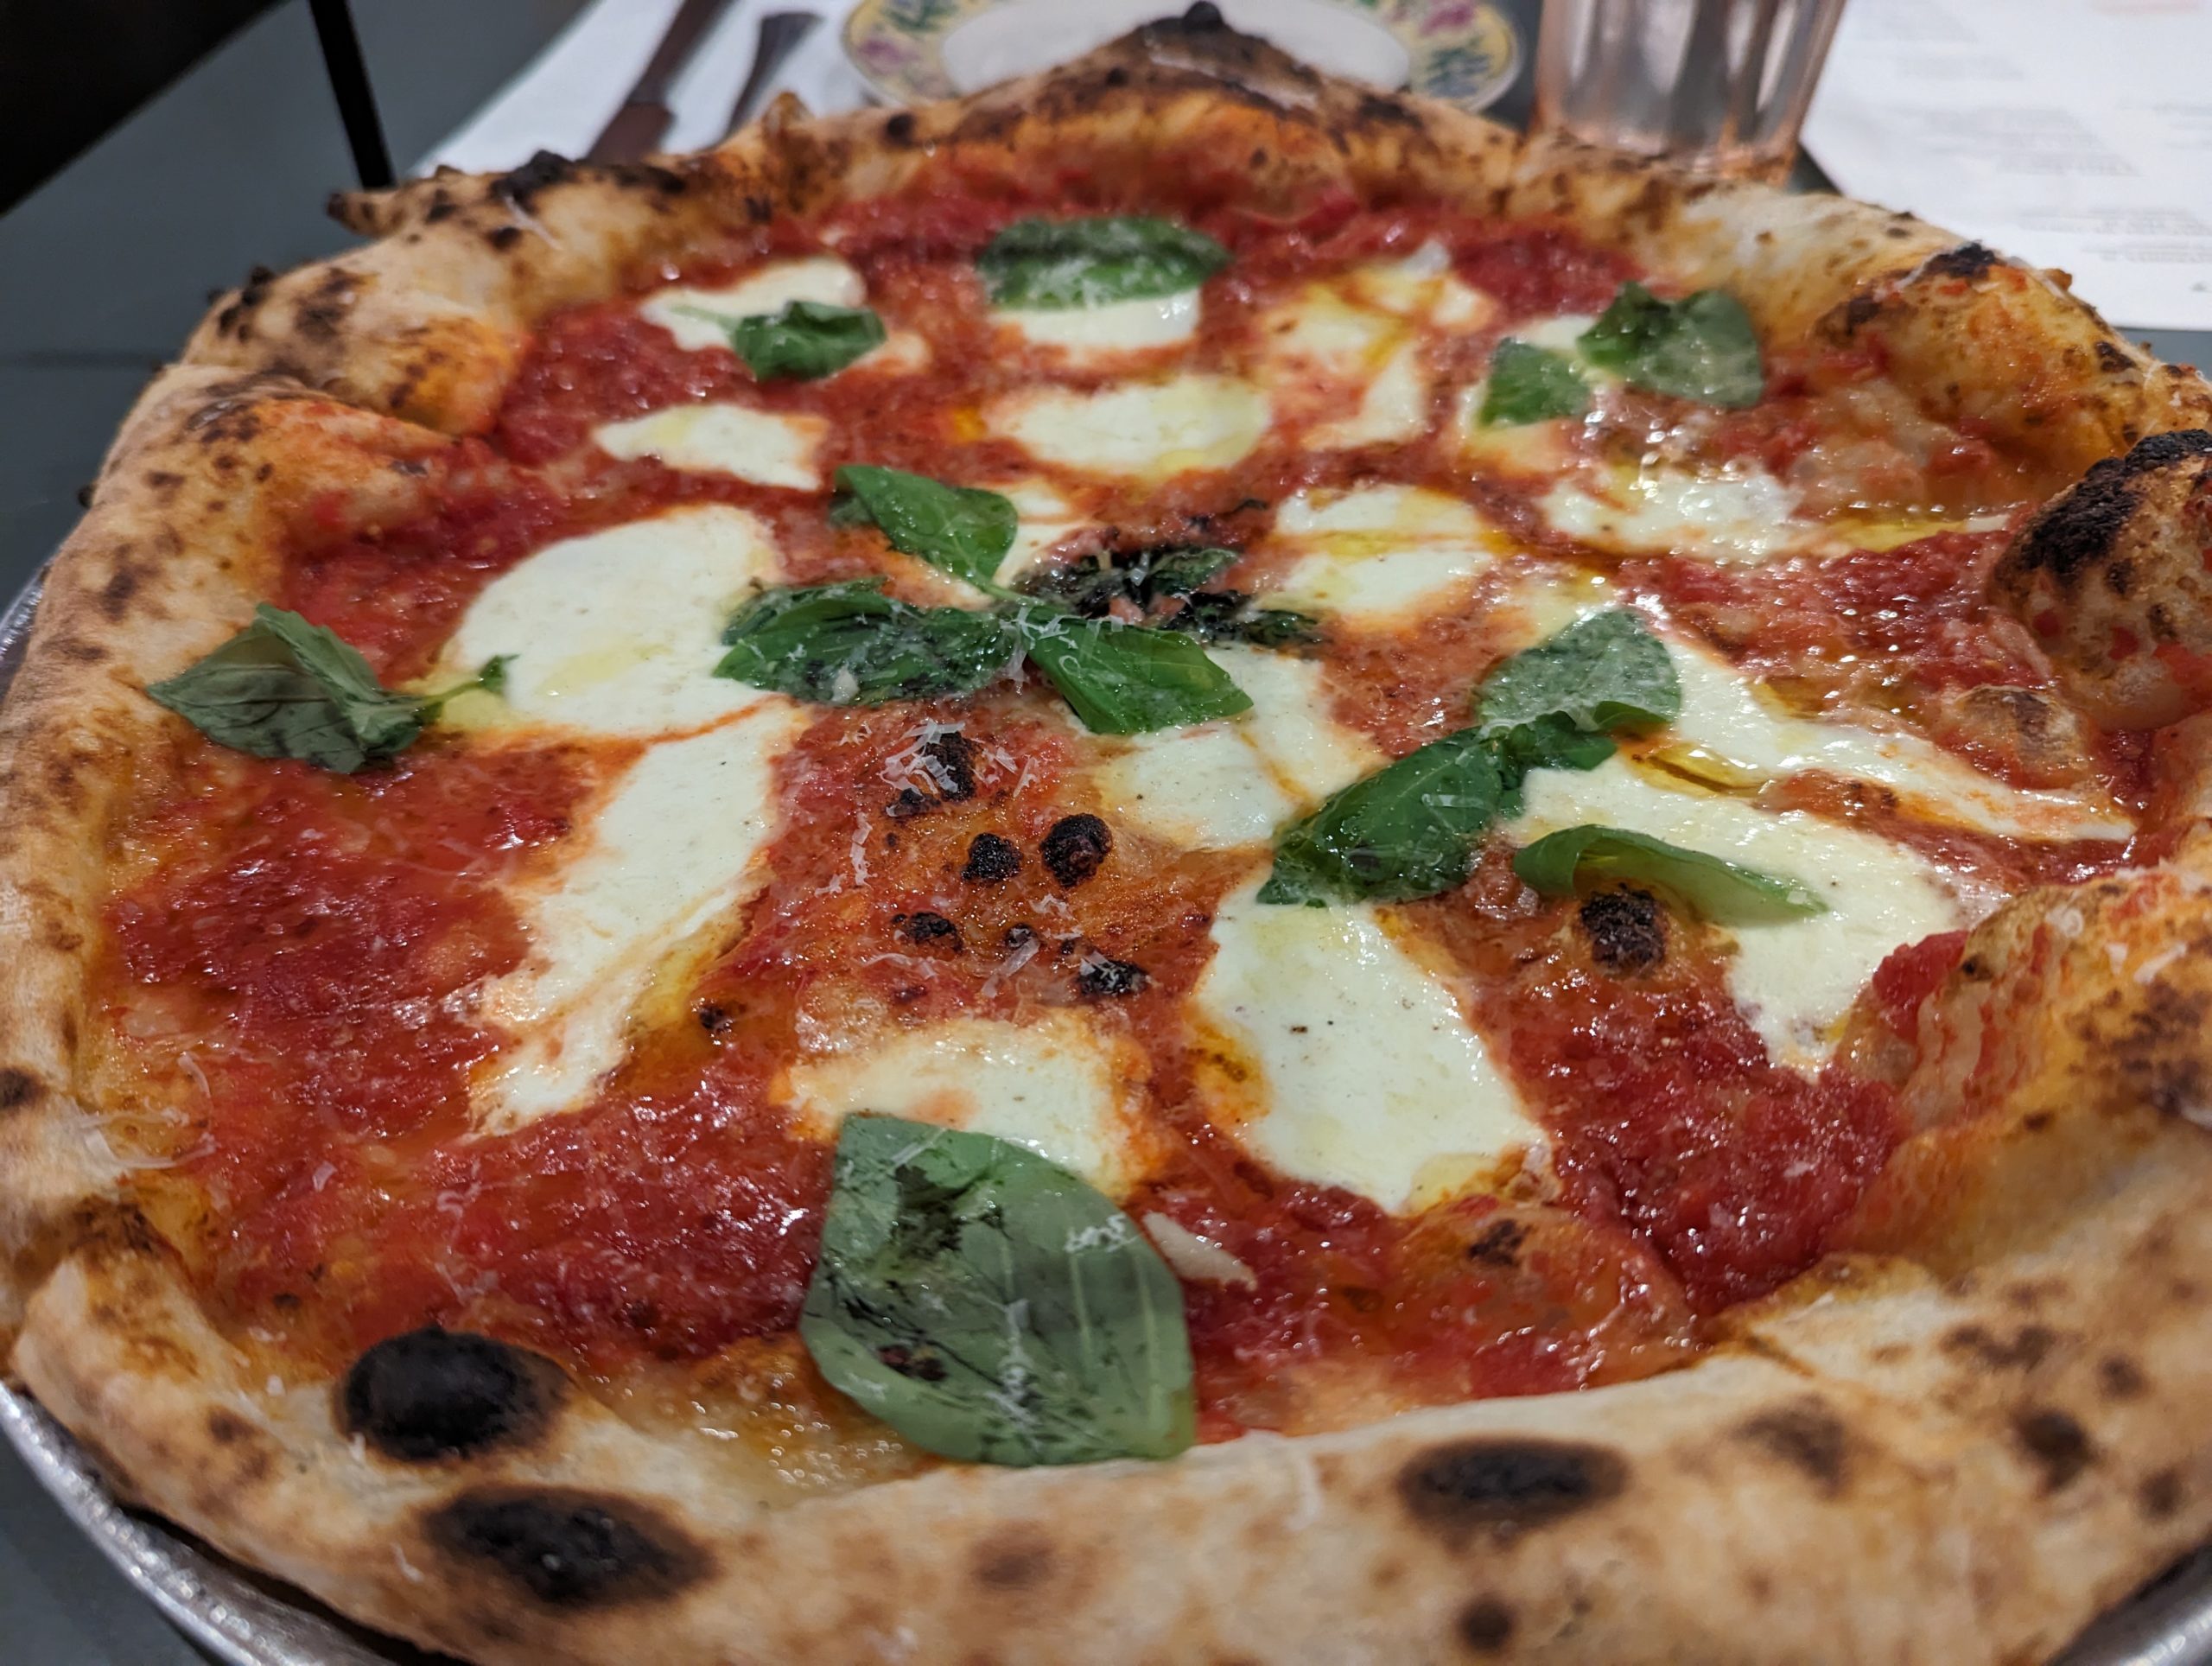
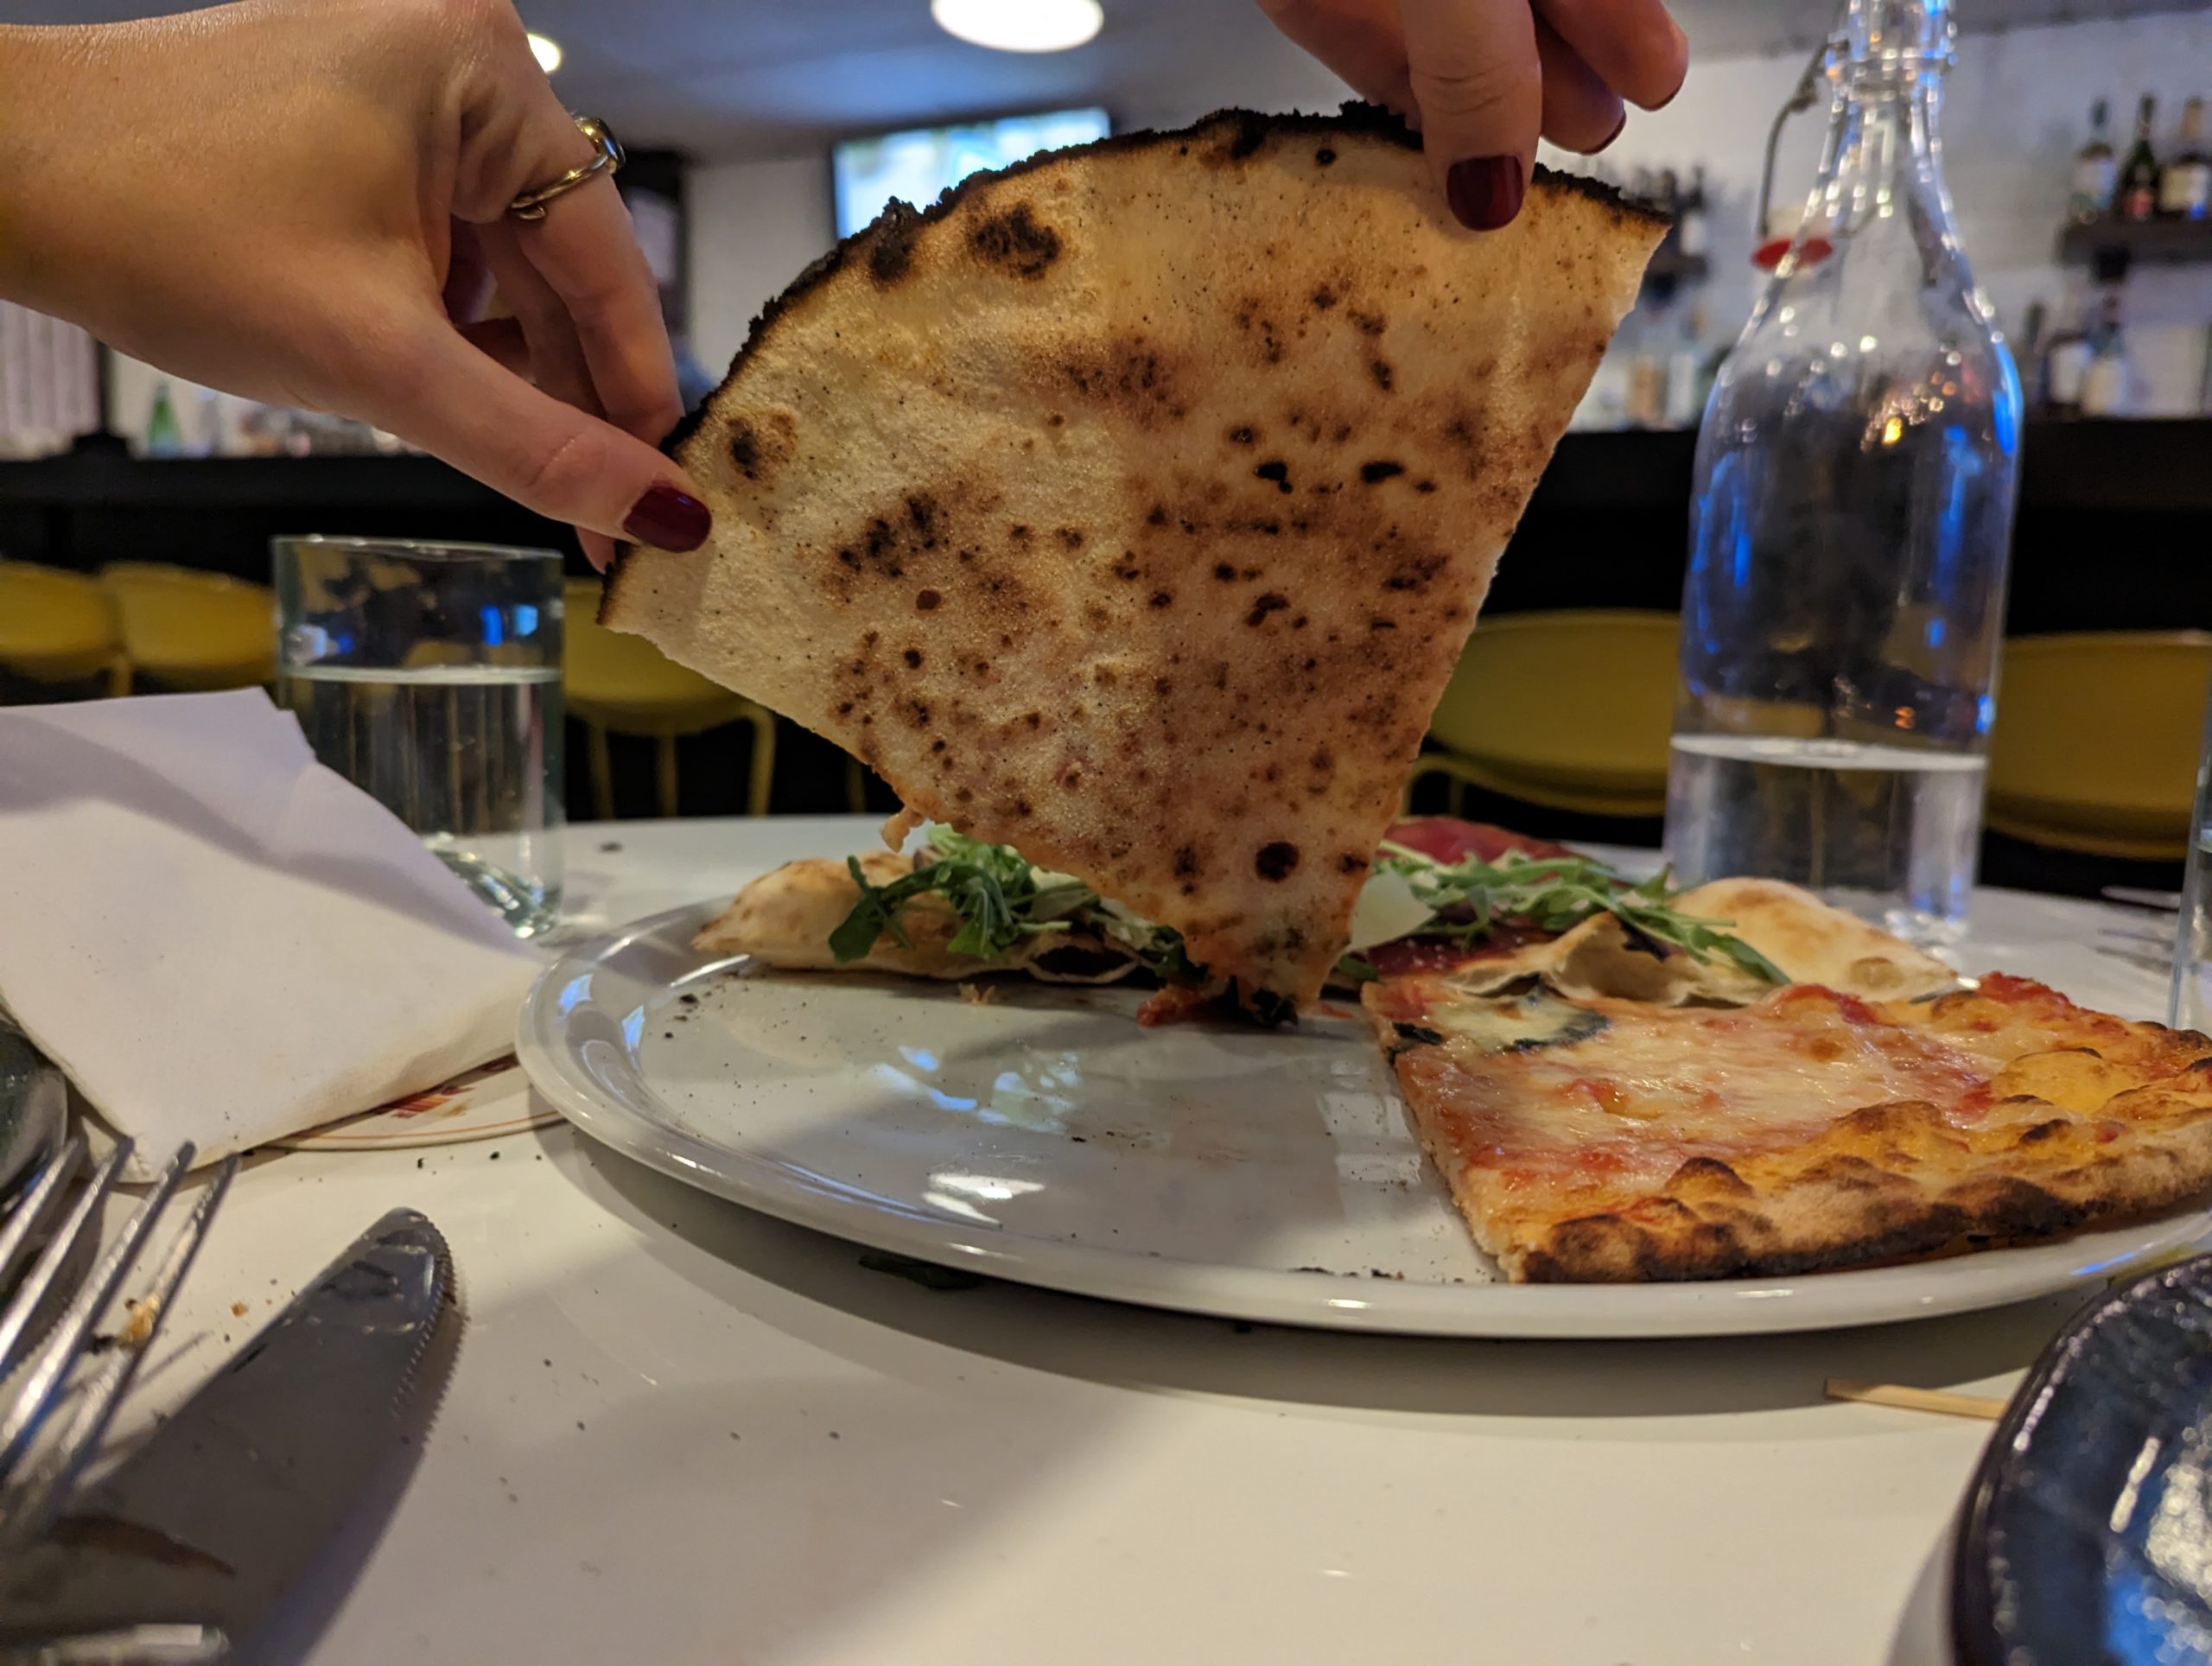
Well cooked, pillowy crust. The base felt light and airy, yet the crust surrounding the pie was very fluffy. Very well done, but not burnt. I’ve eaten many a pie late at night, and unfortunately usually find the oven to be too hot at that point – especially for a busy restaurant.
A light parmesan sprinkle on top of the pie after the cook isn’t customary, but adds a nice little salty touch to add to the natural acidity of the fresh and simple sauce. I would love to know if the mozz is imported, as it hits the Neapolitan notes I was hoping for. The pizza was surprisingly traditional, all the way down to the light sauce. I was very impressed and thoroughly pleased.
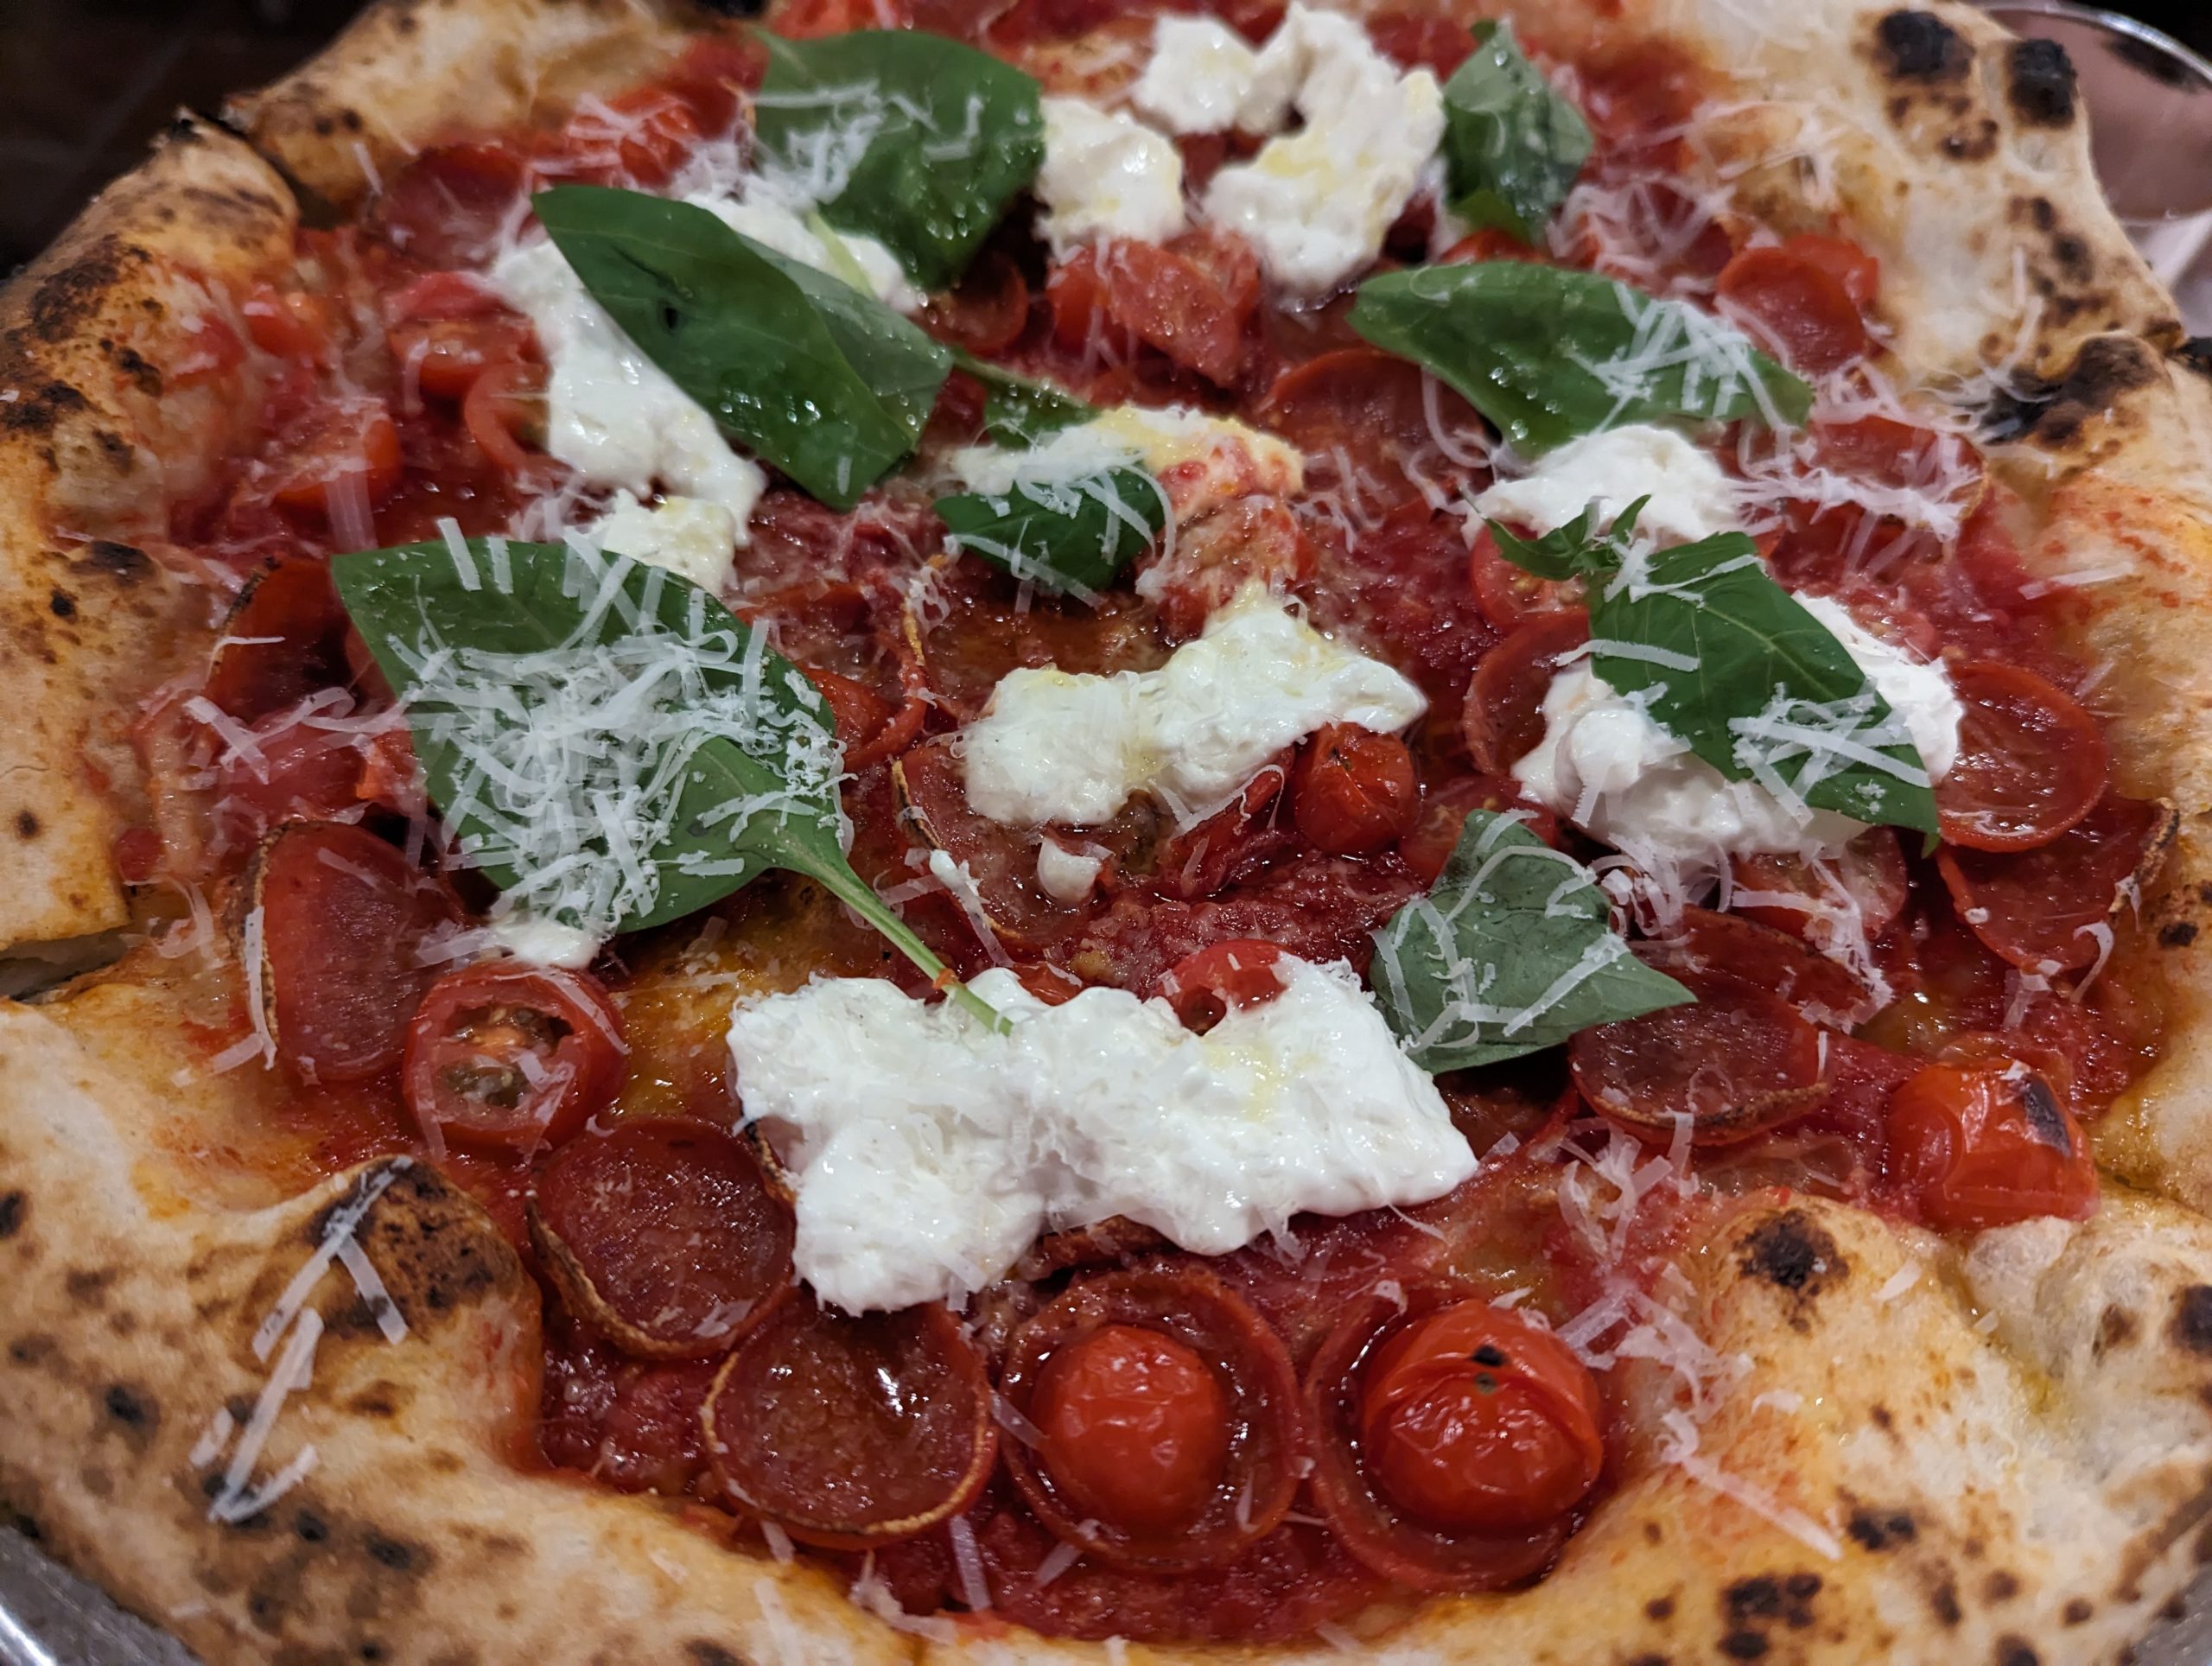
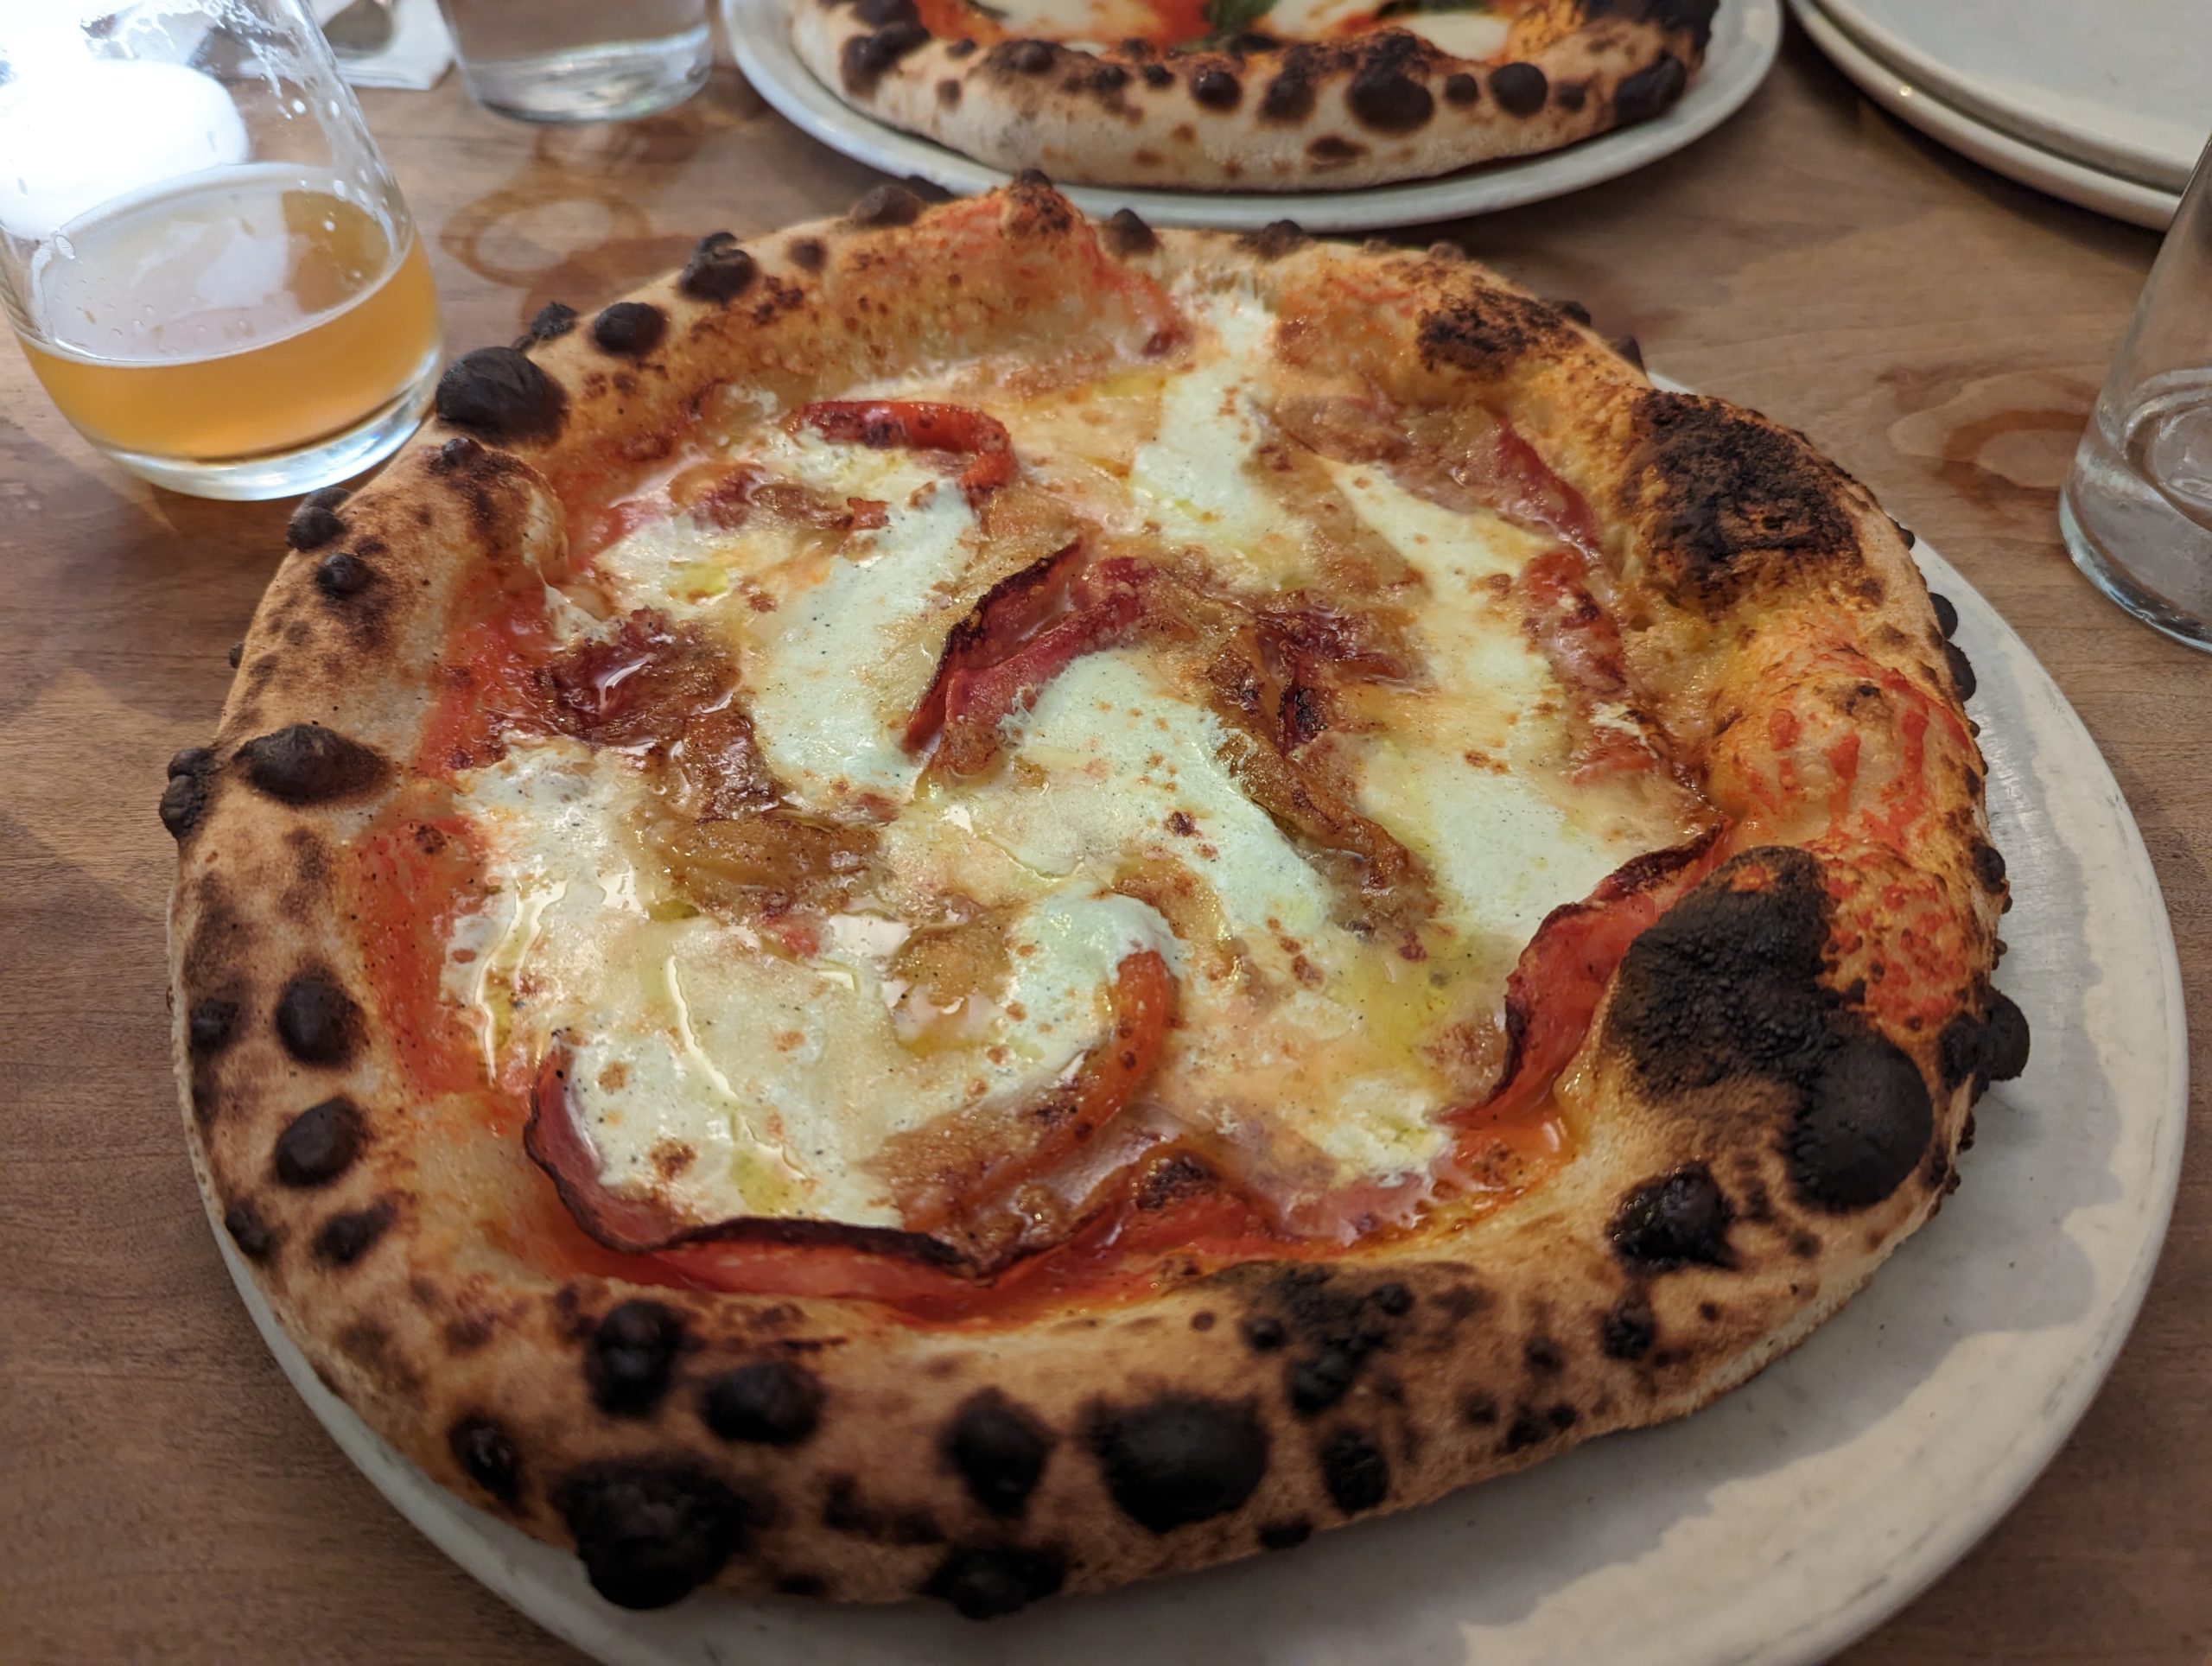
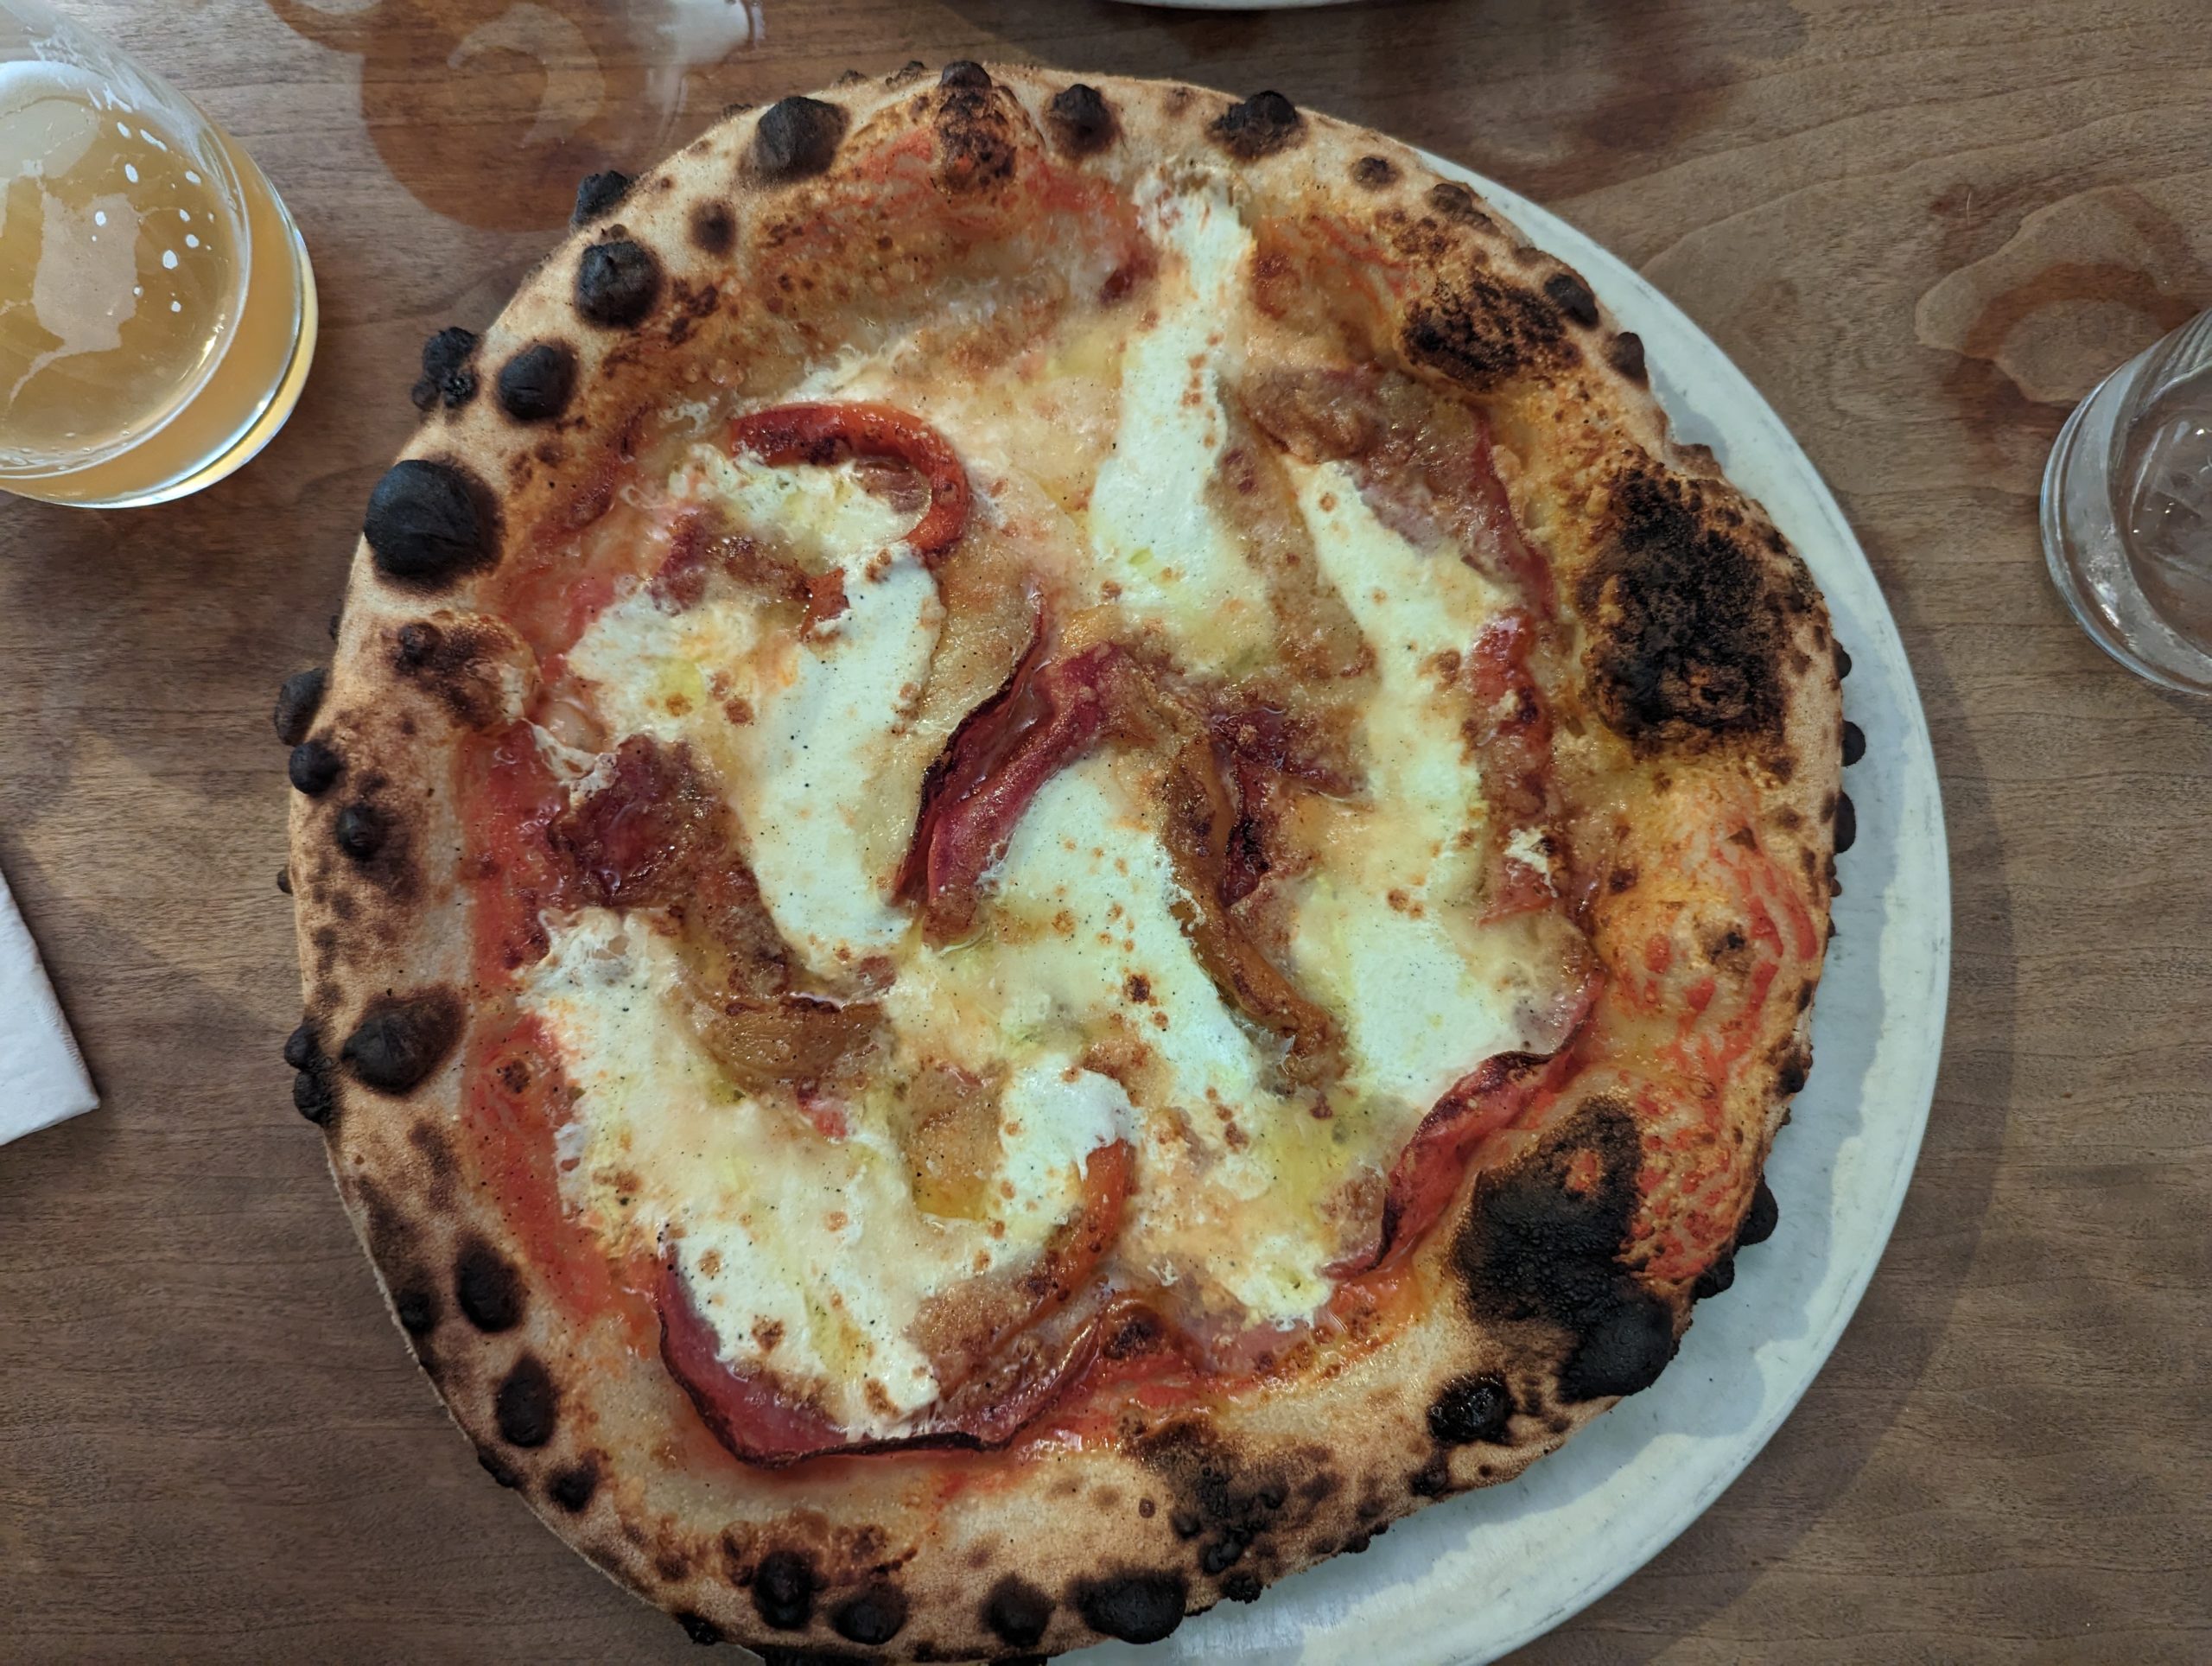
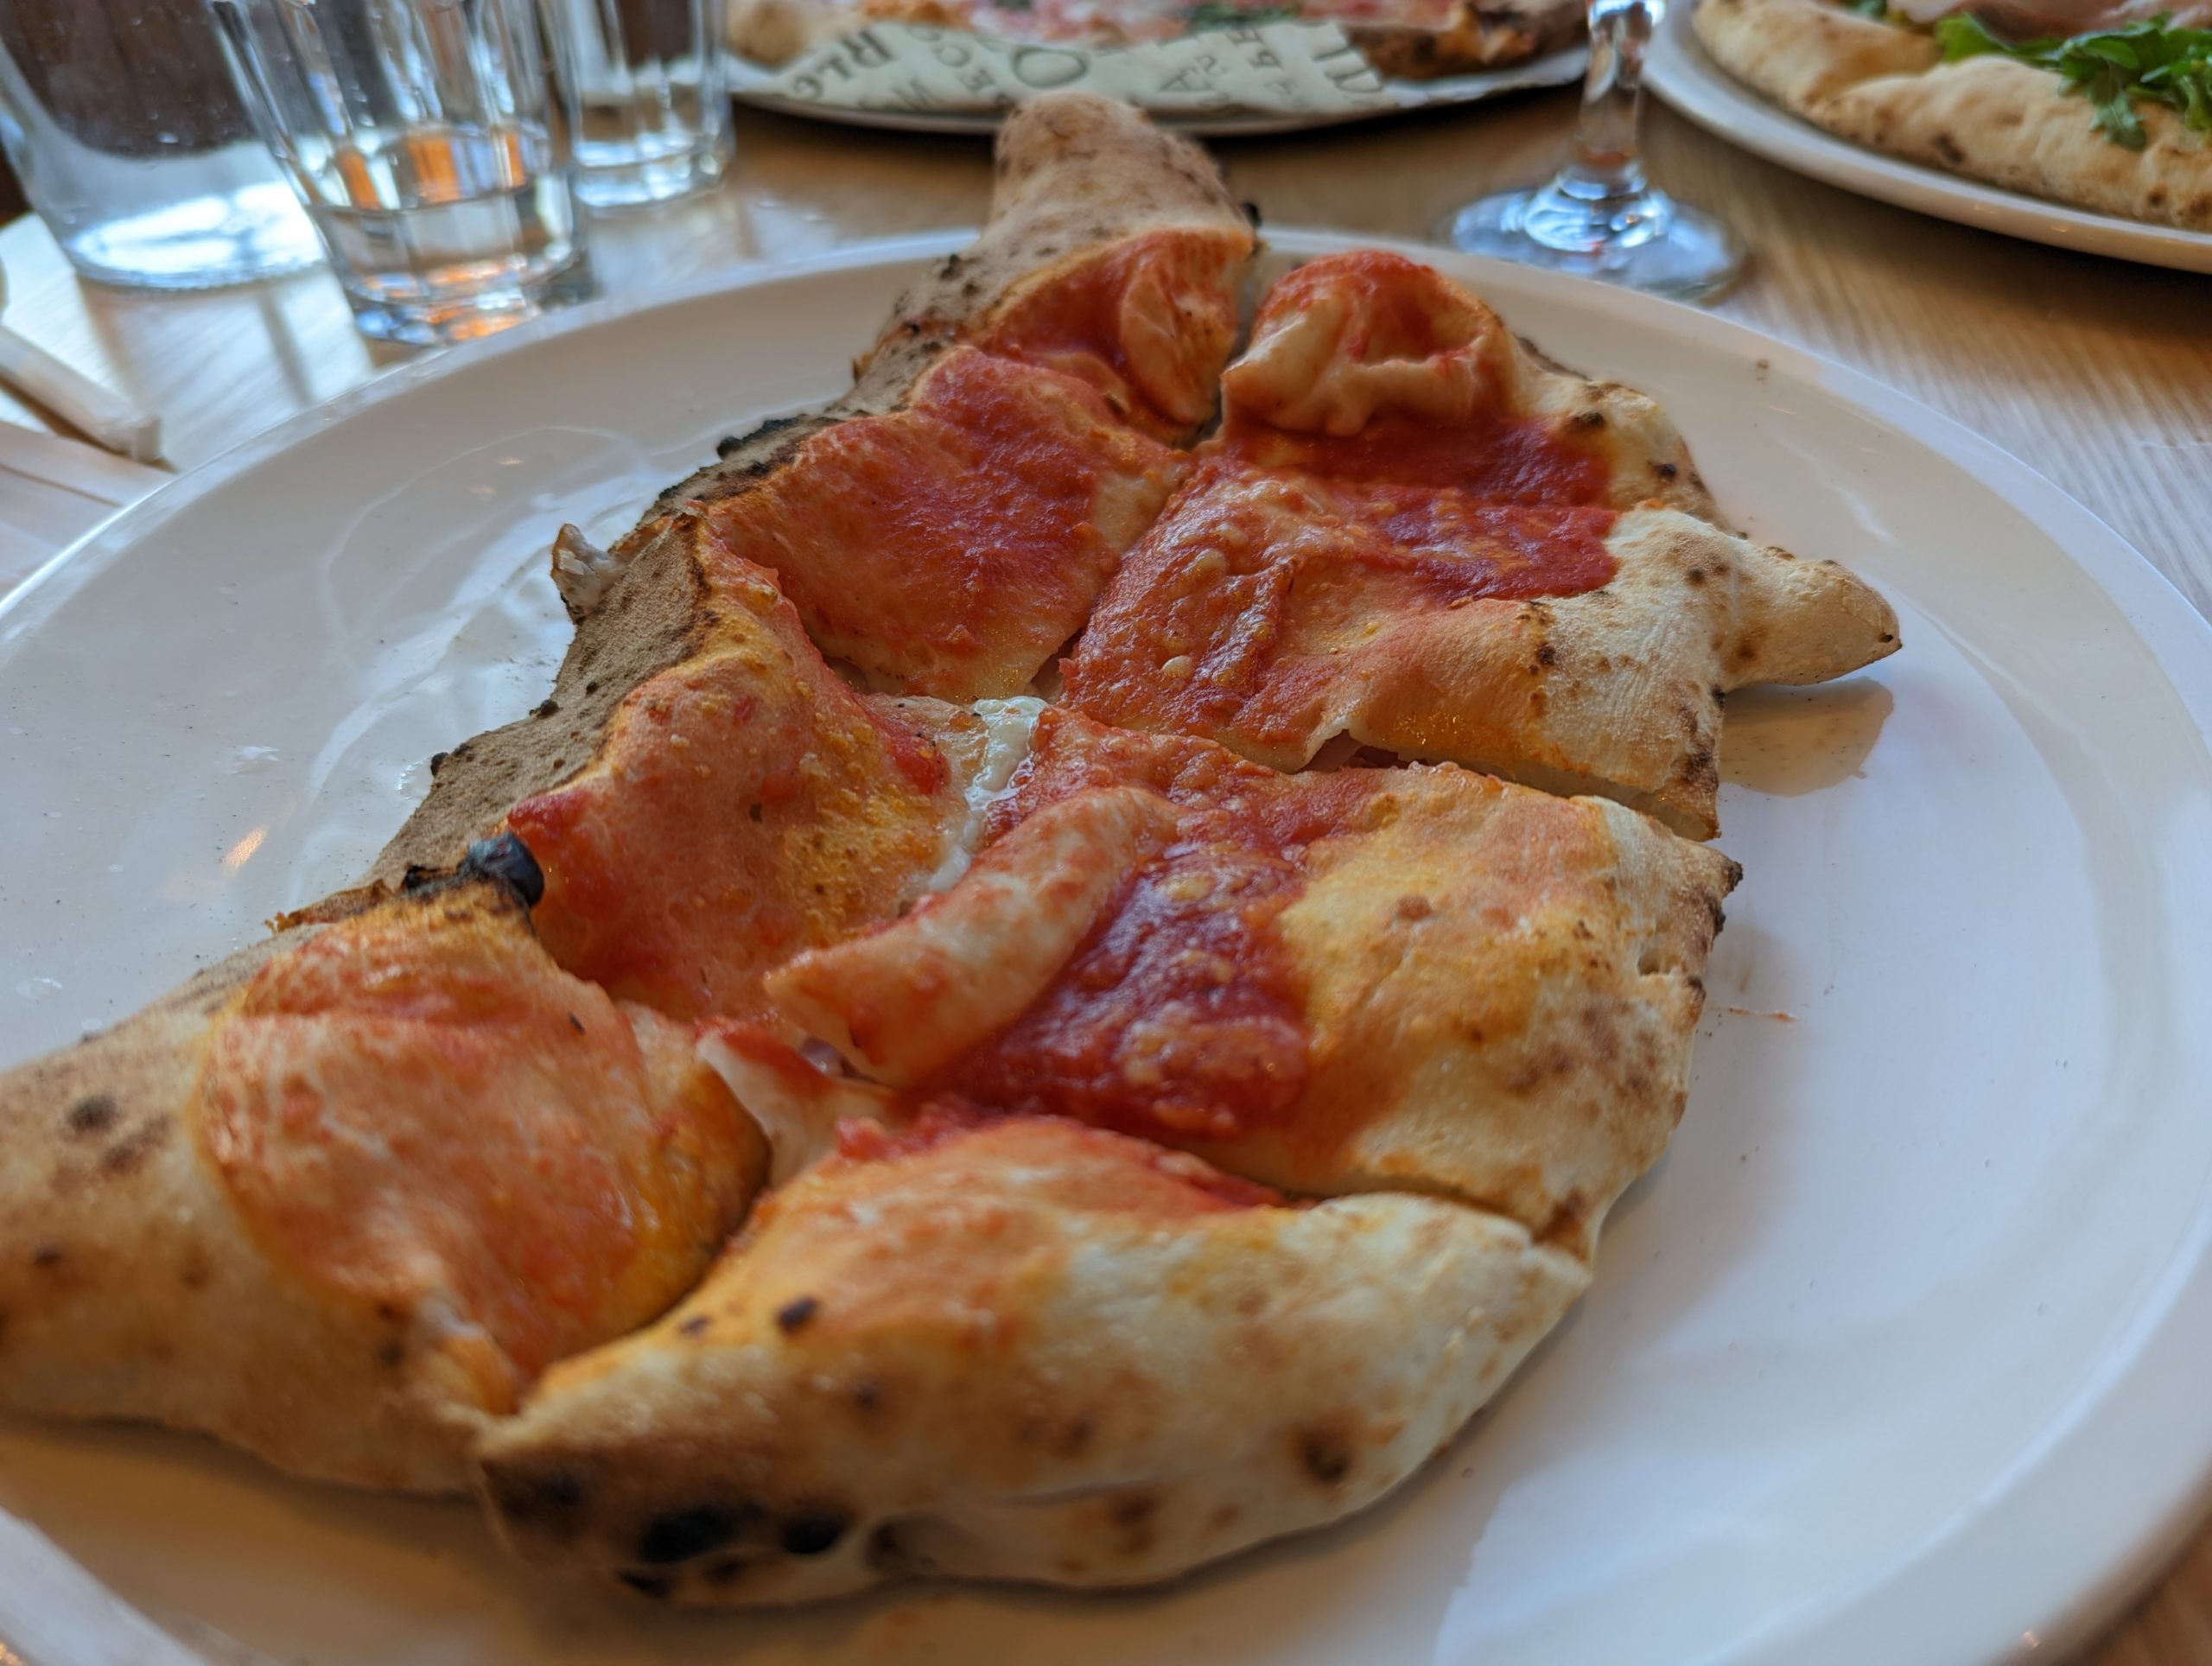
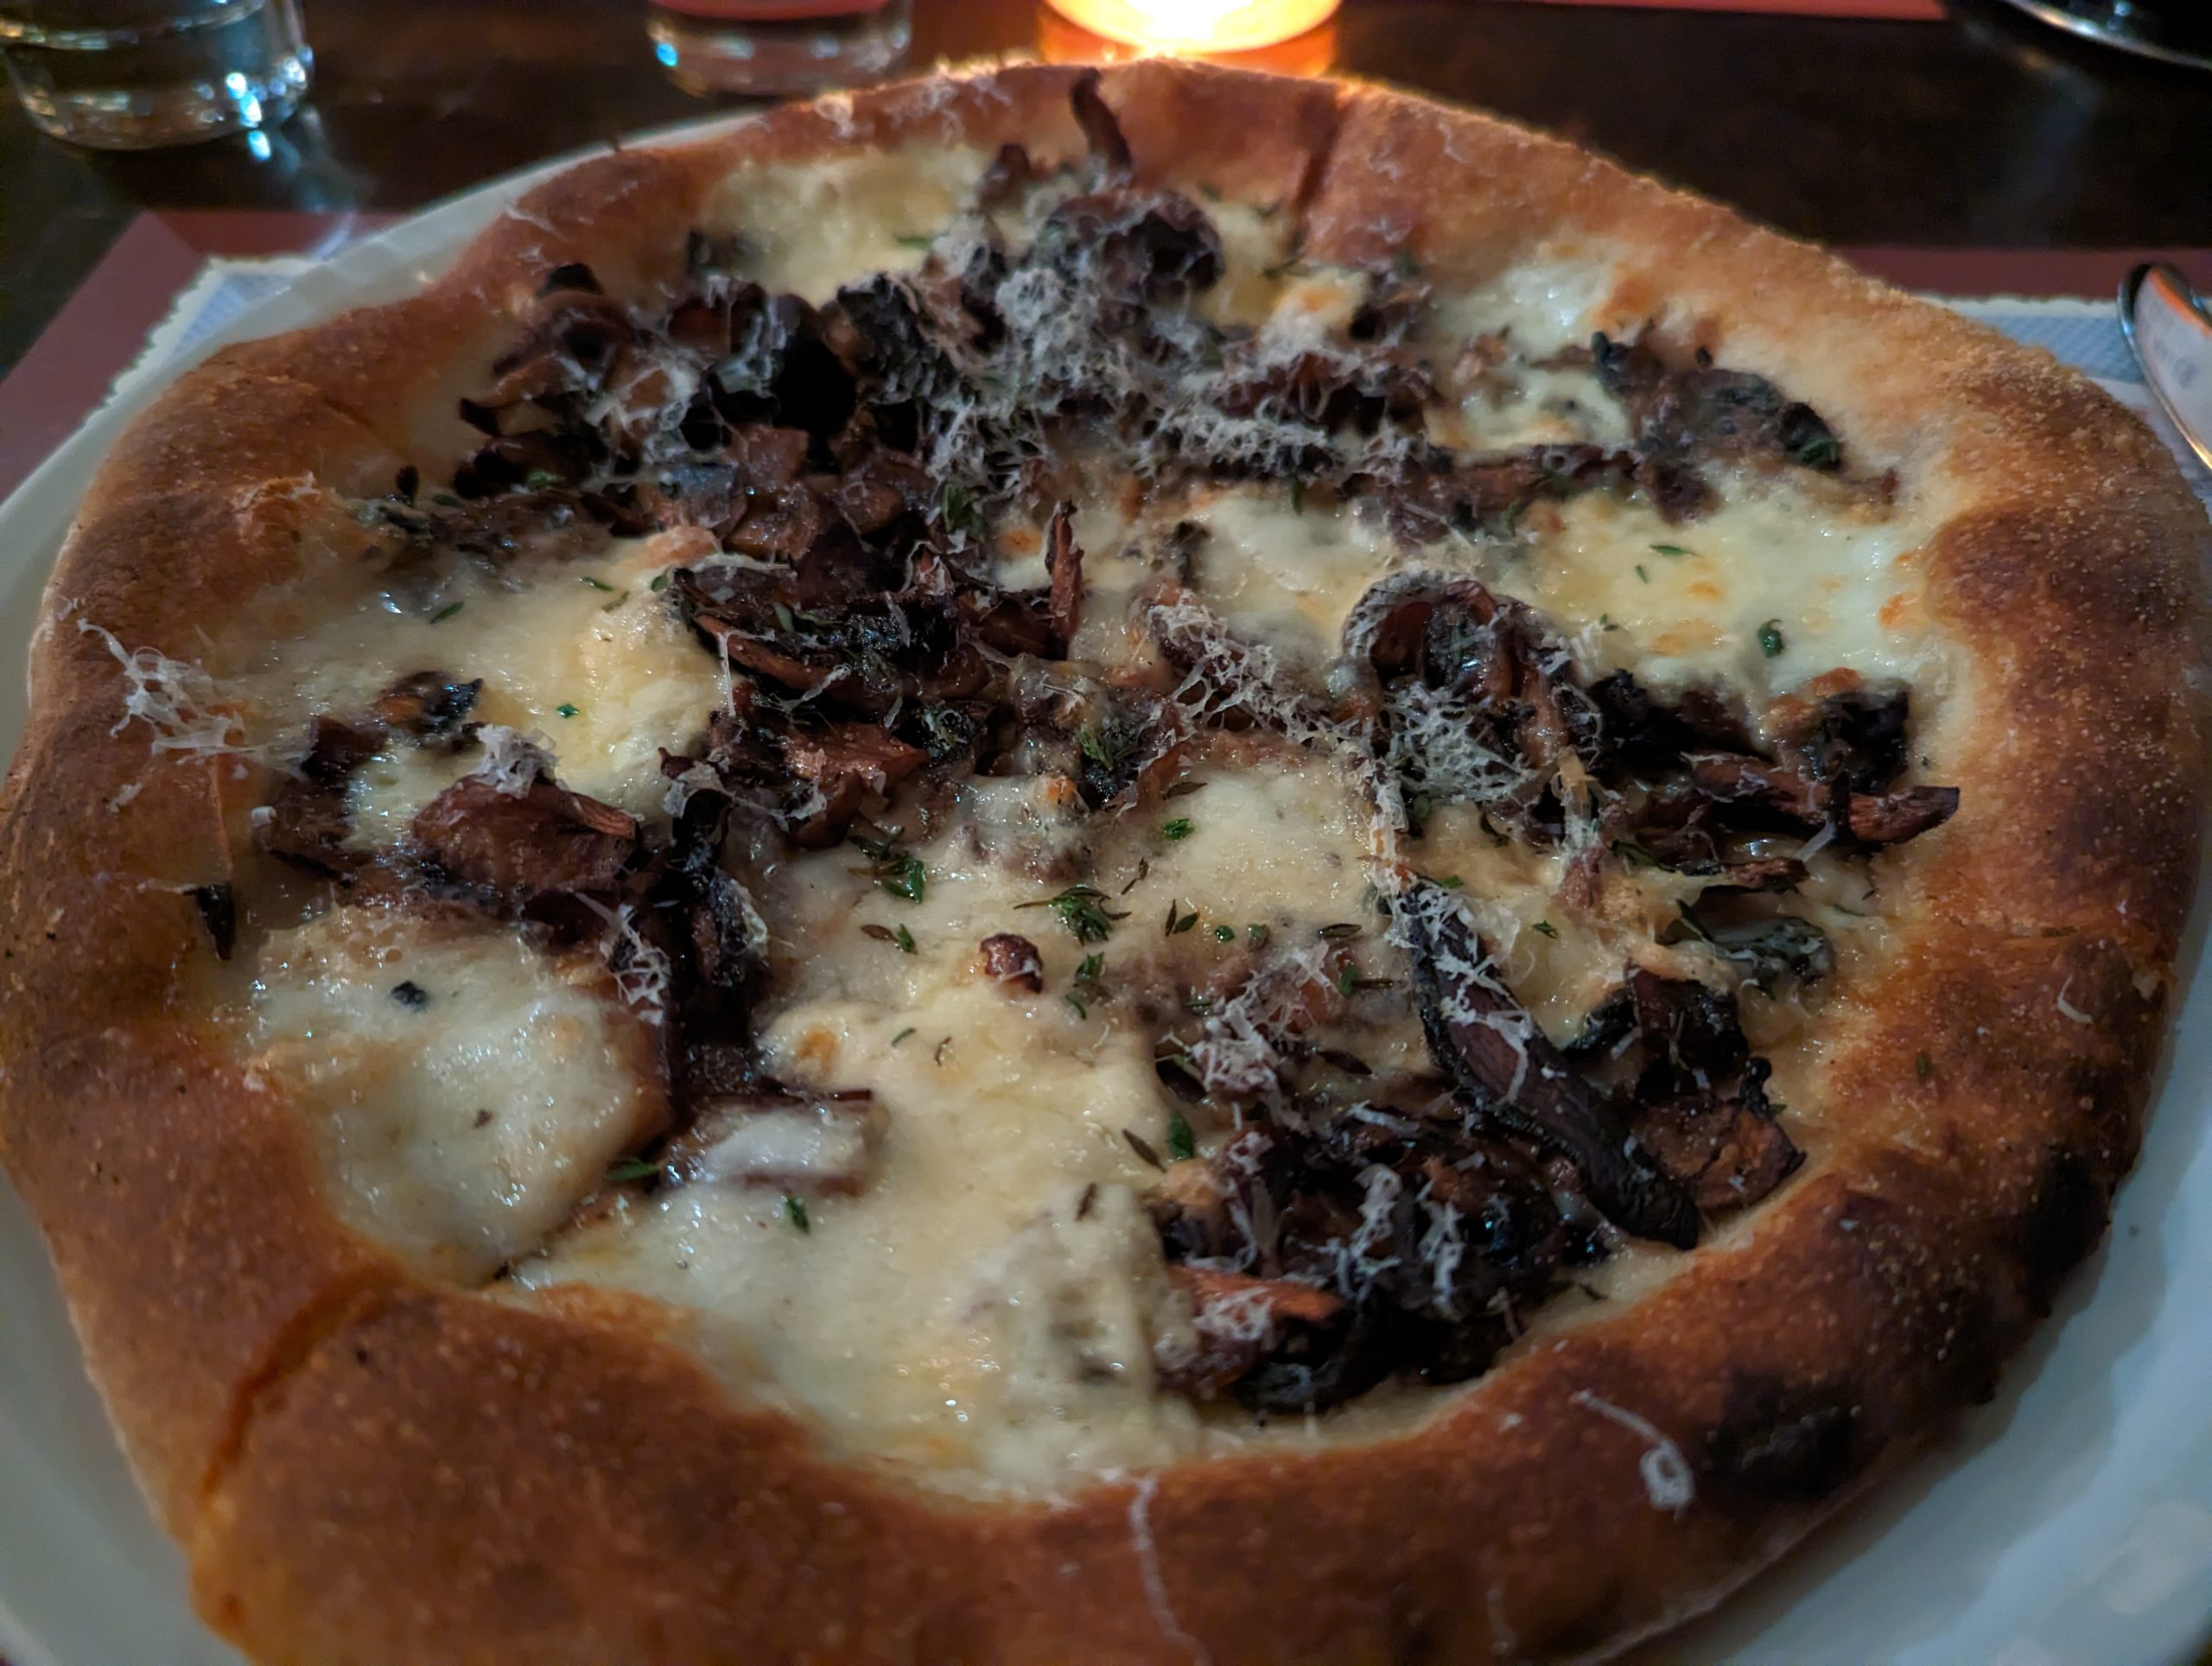
Tomate, Burrata, y Pepperoni
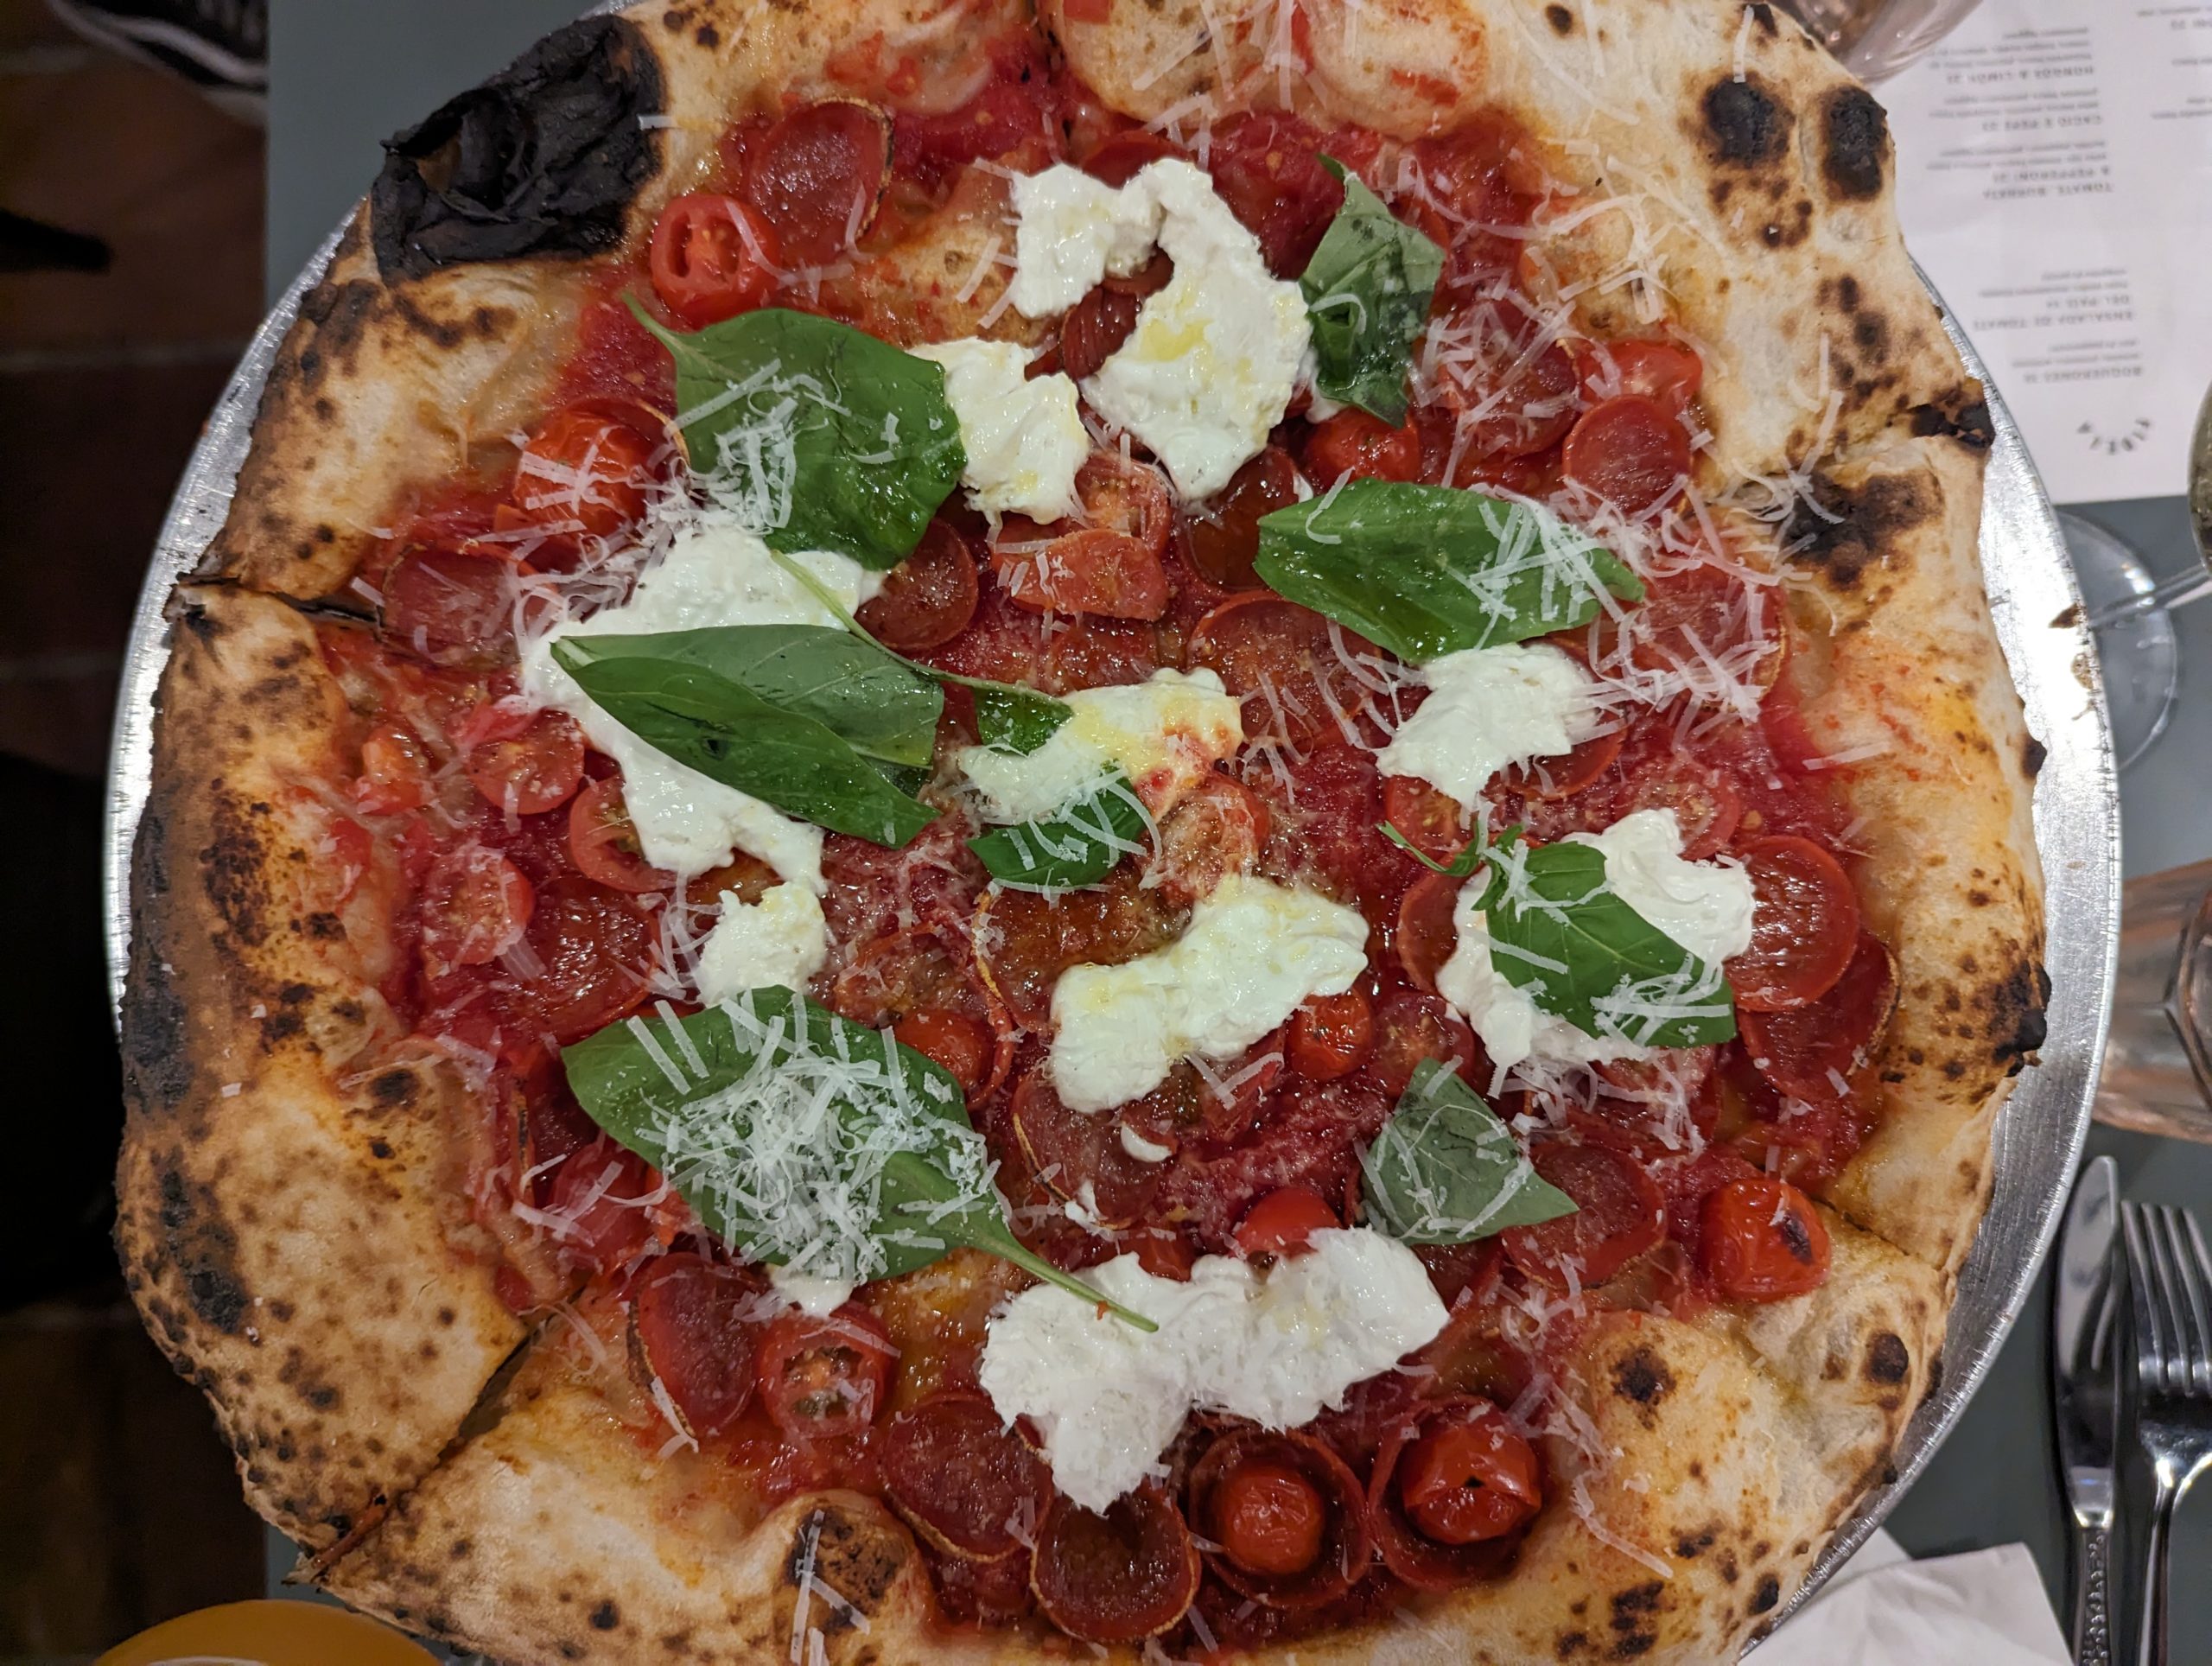
Whoa. WHOA. If you’re visiting PR, stop in for this pizza.
The tomatoes on top are absolutely fantastic. I’m a saucy guy, I love tomatoes, and loved how well the cherry tomato umami played off the decadence of the burrata. The cherry tomatoes slightly reduced in the oven and add a soft pop with each bite. The burrata is wonderful – fluffy, light, and fulfilling. Que rico! The pepperoni curled up, and these oily pork cups thanked the heavens for this delectable pie. The burrata cuts the acidity so well, it makes the entire slice pop and flood your mouth with a flavor fusion. The light honey drizzle sweetens the ronis as they unite the tomatoes and burrata. There is also a light Parm topping here too, inspiring my curiosity of whether this is an element of the Fidela pie.
I’m singing all of the praises for this Boricua Burrata.
I will definitely be returning earlier in the day to catch the oven when it isn’t so hot to ensure that no delicate flavors are challenged by the crust.
Well done chef. Rican Neapolitan…Ricapolitan!


2 Amys Neapolitan Pizzeria (Washington, DC)
∙ Margherita (Tomato, mozzarella di bufala, basil) ∙ Norcia (Tomato, salami, grilled peppers, fresh mozzarella, grana) ∙
I’ve been celebrating Feb 9 for years. Who needs an excuse to eat pizza? Naturally, 2 Amys was packed. Most may not fiend for pizza like I do, but everyone deserves a pie on the best holiday there is.
I’ve been meaning to make my way to 2 Amys for a long time. As I typically try the local pizza joints in my travels, I haven’t done much to explore the restaurants in my backyard. I’ve been missing out when it comes to this restaurant, let me tell you.
I’m a fan of any AVPN (Associazione Verace Pizza Napoletana) certified restaurant. They just know how it’s done, and provide the genuine American Neapolitan pizza experience.
We opted for the pizzas to be served uncut. My understanding is that it helps to not soak the crust with the toppings, which is helpful with this style of preparation. Let’s just say the staff really got it done on a night they were packed for a pizza-centric celebration.
Margherita

Absolutely delicious ingredients – very fresh and authentic. The crust is as expected, doesn’t really support at all. There is a serious dearth of sauce here, my assumption is likely because of the crust. I’m a saucy guy, so I’m a little let down, but I understand. I do wonder if this is the AVPN style? The crust is strikingly similar to that of my local favorite, Pupatella. The sauce is wonderful, and I wanted more.
Norcia
There was a fair amount of oil to start. That said, the pie has a well balanced flavor profile. The parmesan is really nice touch. The salami is fantastic – crispy and fresh. I may defer to spicy salami, but this is surely a crowd-pleaser. Also, the sweet peppers are awesome…who doesn’t love peppers? Fun for everyone, even those who are sensitive to spicy pizza.
L’Antica Pizzeria da Michele (Los Angeles, CA)
The Ultimate Los Angeles Pizza Tour - Curated by Alessandra
∙ MARGHERITA (Tomato, Fior di Latte, Pecorino, Basil), DIAVOLA (Tomato, Fior di Latte, Pecorino, Basil, Spicy Salame) ∙
The fourth and final stop on the epic LA pizza tour, and what an amazing ride it’s been. This restaurant is a franchise of the famous original in Naples, and my love had high expectations. We arrived to the restaurant around 9, and it felt wrong from the start. This location was very LA. It was like a nightclub…super chic design – the entryway featured a fireplace, the glowing bar sat below a skylight. The original in Naples is very unassuming in comparison. The back patio looked very cool, but we were seated inside. It was cold anyway.
Put simply, the last restaurant on a tour like this will likely not be the best because you’ve already eaten 9 pizzas before it. Someone has to come in last, but it does suck for your review of the pie.
Margherita
We ordered two pies, and the marg came out maybe a minute later. The second pie didn’t arrive. We were confused, but the server (from the back, not our server), said ‘margherita’ as he put down the pie. We started eating, and our two pies show up 10 minutes later. We should’ve given this one back and took ours.
The pizza tasted like it was smoked. Super odd – I couldn’t tell if it was because it was the end of the night and the oven had a lot of ash in it. I couldn’t tell if the pecorino was making it taste like that. I can only imagine that if this restaurant were placed differently along the tour, we would’ve had a different impression. Being the 10th & 11th pizzas on the 2-day tour didn’t help our perspective.
The crust was good, fairly light and airy, yet not terribly well structured. The pie could’ve been eaten with utensils. All this said, the pizzas were MASSIVE. They were huge! Show up hungry, and don’t eat a ton of pizza in the days preceding.


Diavola
I love a good diavola pizza. Diavola is ‘devil’ in Italian. I have devilish little horns glowing on my dome when a spicy salame pie is placed in front of me.
The pie was good, but the cook was almost worse than the prior. Some slices were more well done than others. As it was the end of the night, I wasn’t surprised to see it wasn’t cooked evenly. The spicy salame was wonderful – cooked to perfection – slightly crispy, yet juicy. Flavor wasn’t terribly hot, but it was still great. The salame was cut long ways, something that was new to me and I enjoyed.
Result
Given the fact that this was the last stop on the pizza tour and it was later in the evening, I don’t feel like my assessment of the pizza was great. I almost owe this place a return visit. I will; however, surely be stopping at the original in Naples.
La Pizza & La Pasta - Eataly (Los Angeles, CA)
The Ultimate Los Angeles Pizza Tour - Curated by Alessandra
Eataly has teamed up with the experts at Rossopomodoro to bring us traditional Neapolitan pizza.
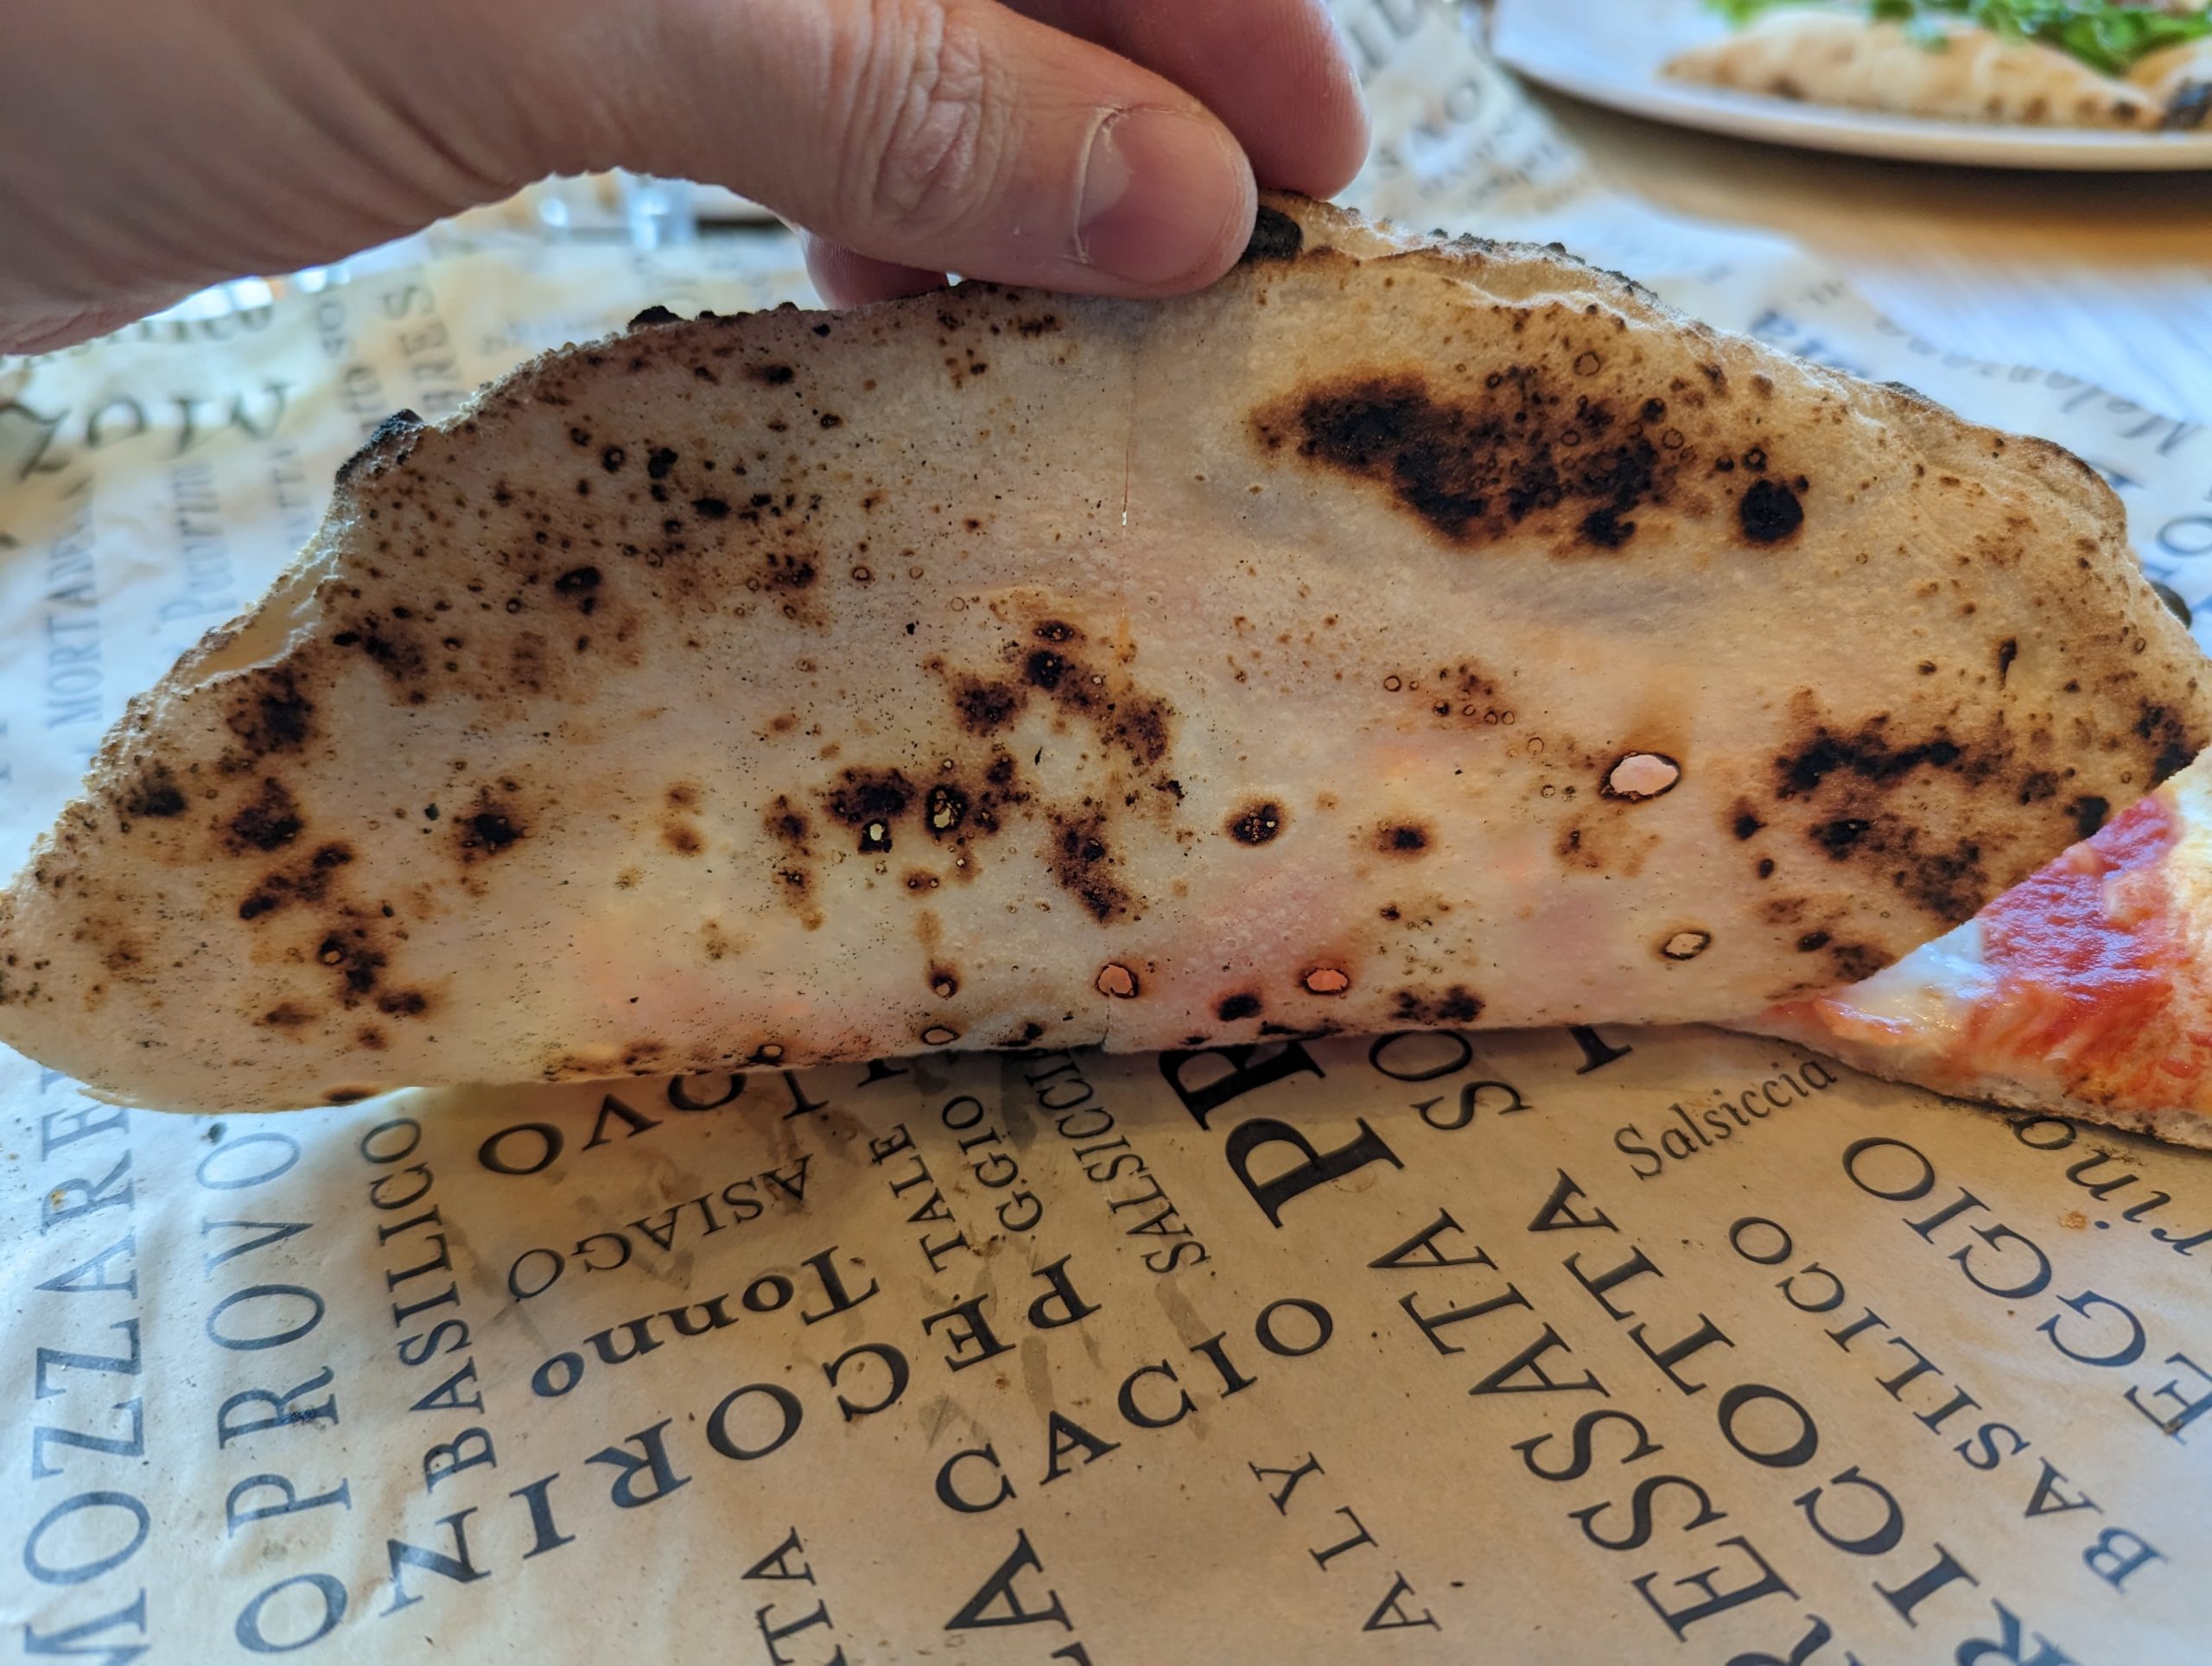
∙ MARGHERITA VERACE TSG (San Marzano Tomato Sauce, Buffalo Mozzarella, Fresh Basil, Extra Virgin Olive Oil), BURRATA (Burrata, Arugula, Rovagnati Prosciutto di Parma DOP 18-Months, Basil, Extra Virgin Olive Oil) ∙
Nearing the end of the pizza tour, we visited the famous Eataly – a massive Italian-import focused marketplace with restaurants, groceries, and food counters. The restaurant was pumping out some fire pies – courtesy of their partnership with Rossopomodoro, a Naples-headquartered pizza chain. My love heard this would be the best pie in LA. Spoiler alert: it is.


Margherita
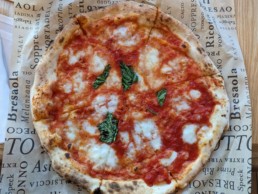
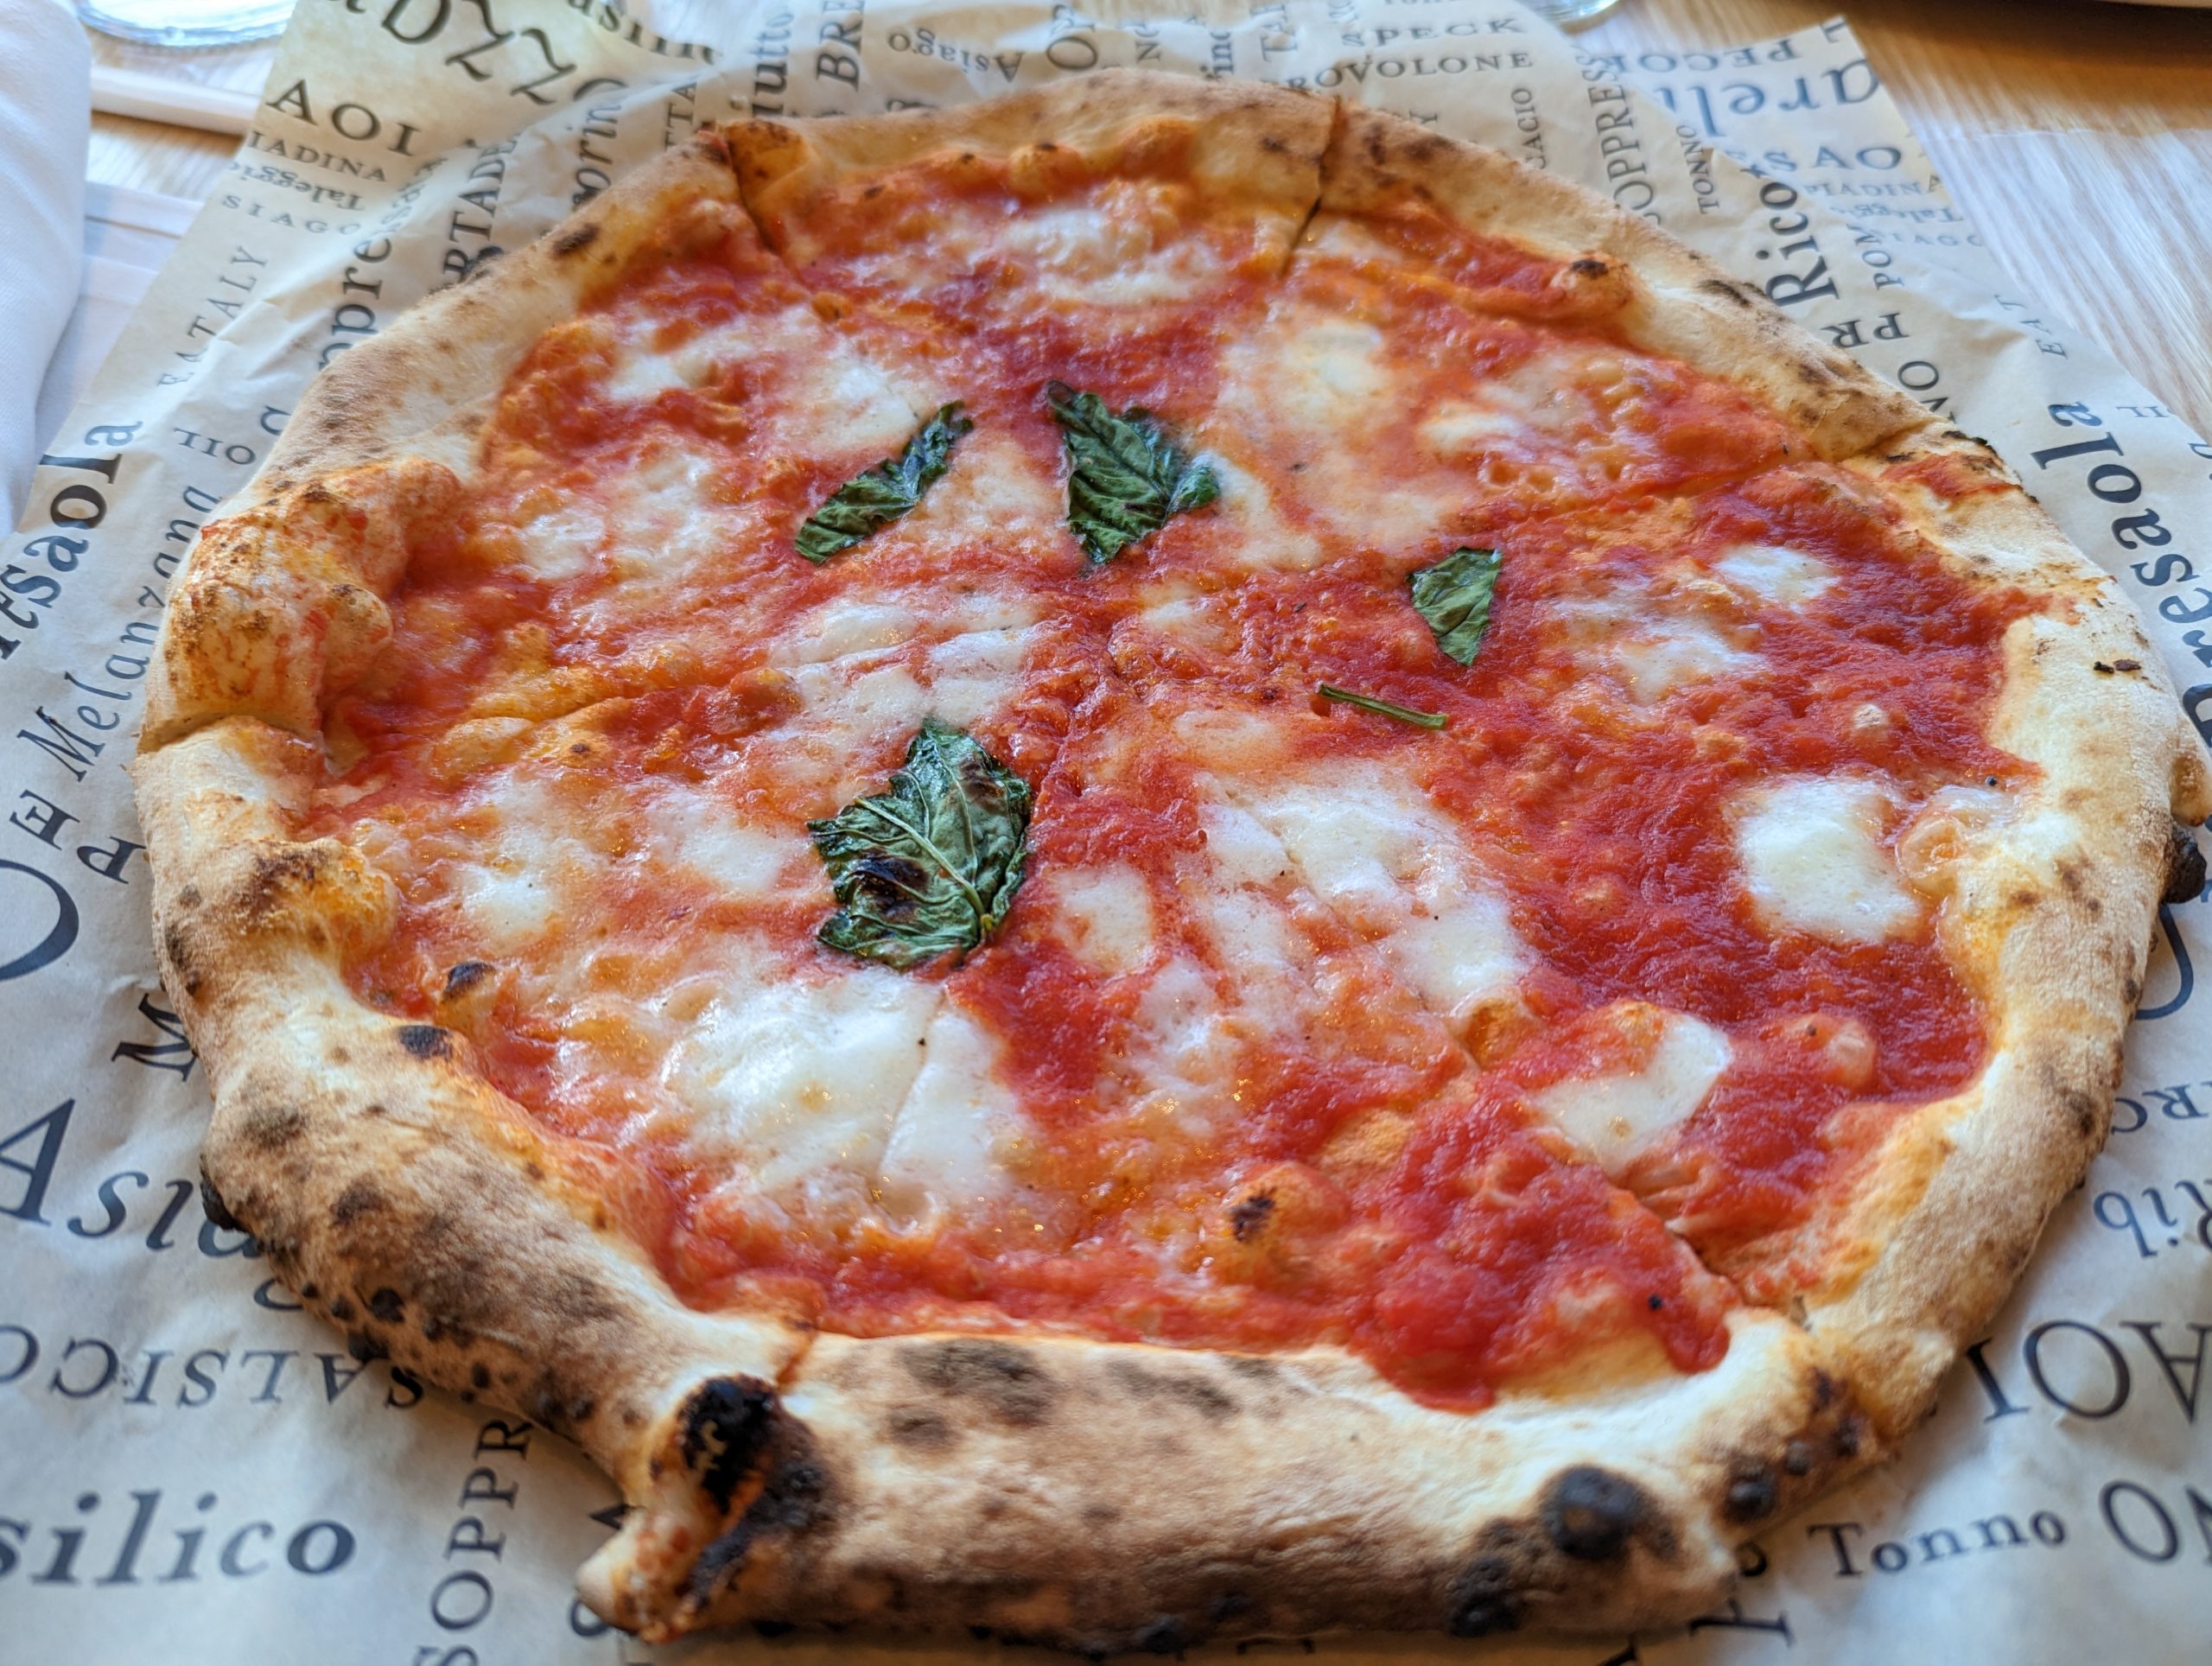
The pie is perfectly balanced. There is a dazzling char on the crust. No rubbery mozz bullshit…this buffalo mozzarella rivals the burrata in its tender deliciousness.
It’s almost impossible to differentiate between each element as they coalesce beautifully. The sauce is so incredibly fresh…this San Marzano pomodoro is *chef’s kiss*. Only to be expected from a place touting their imported goods. Each bite is harmoniously decadent. The crust is magical, spotted like a beautiful camouflaged leopard. Dare I even say it gives Nancy Silverton a run for her money.
This is what pizza is all about.
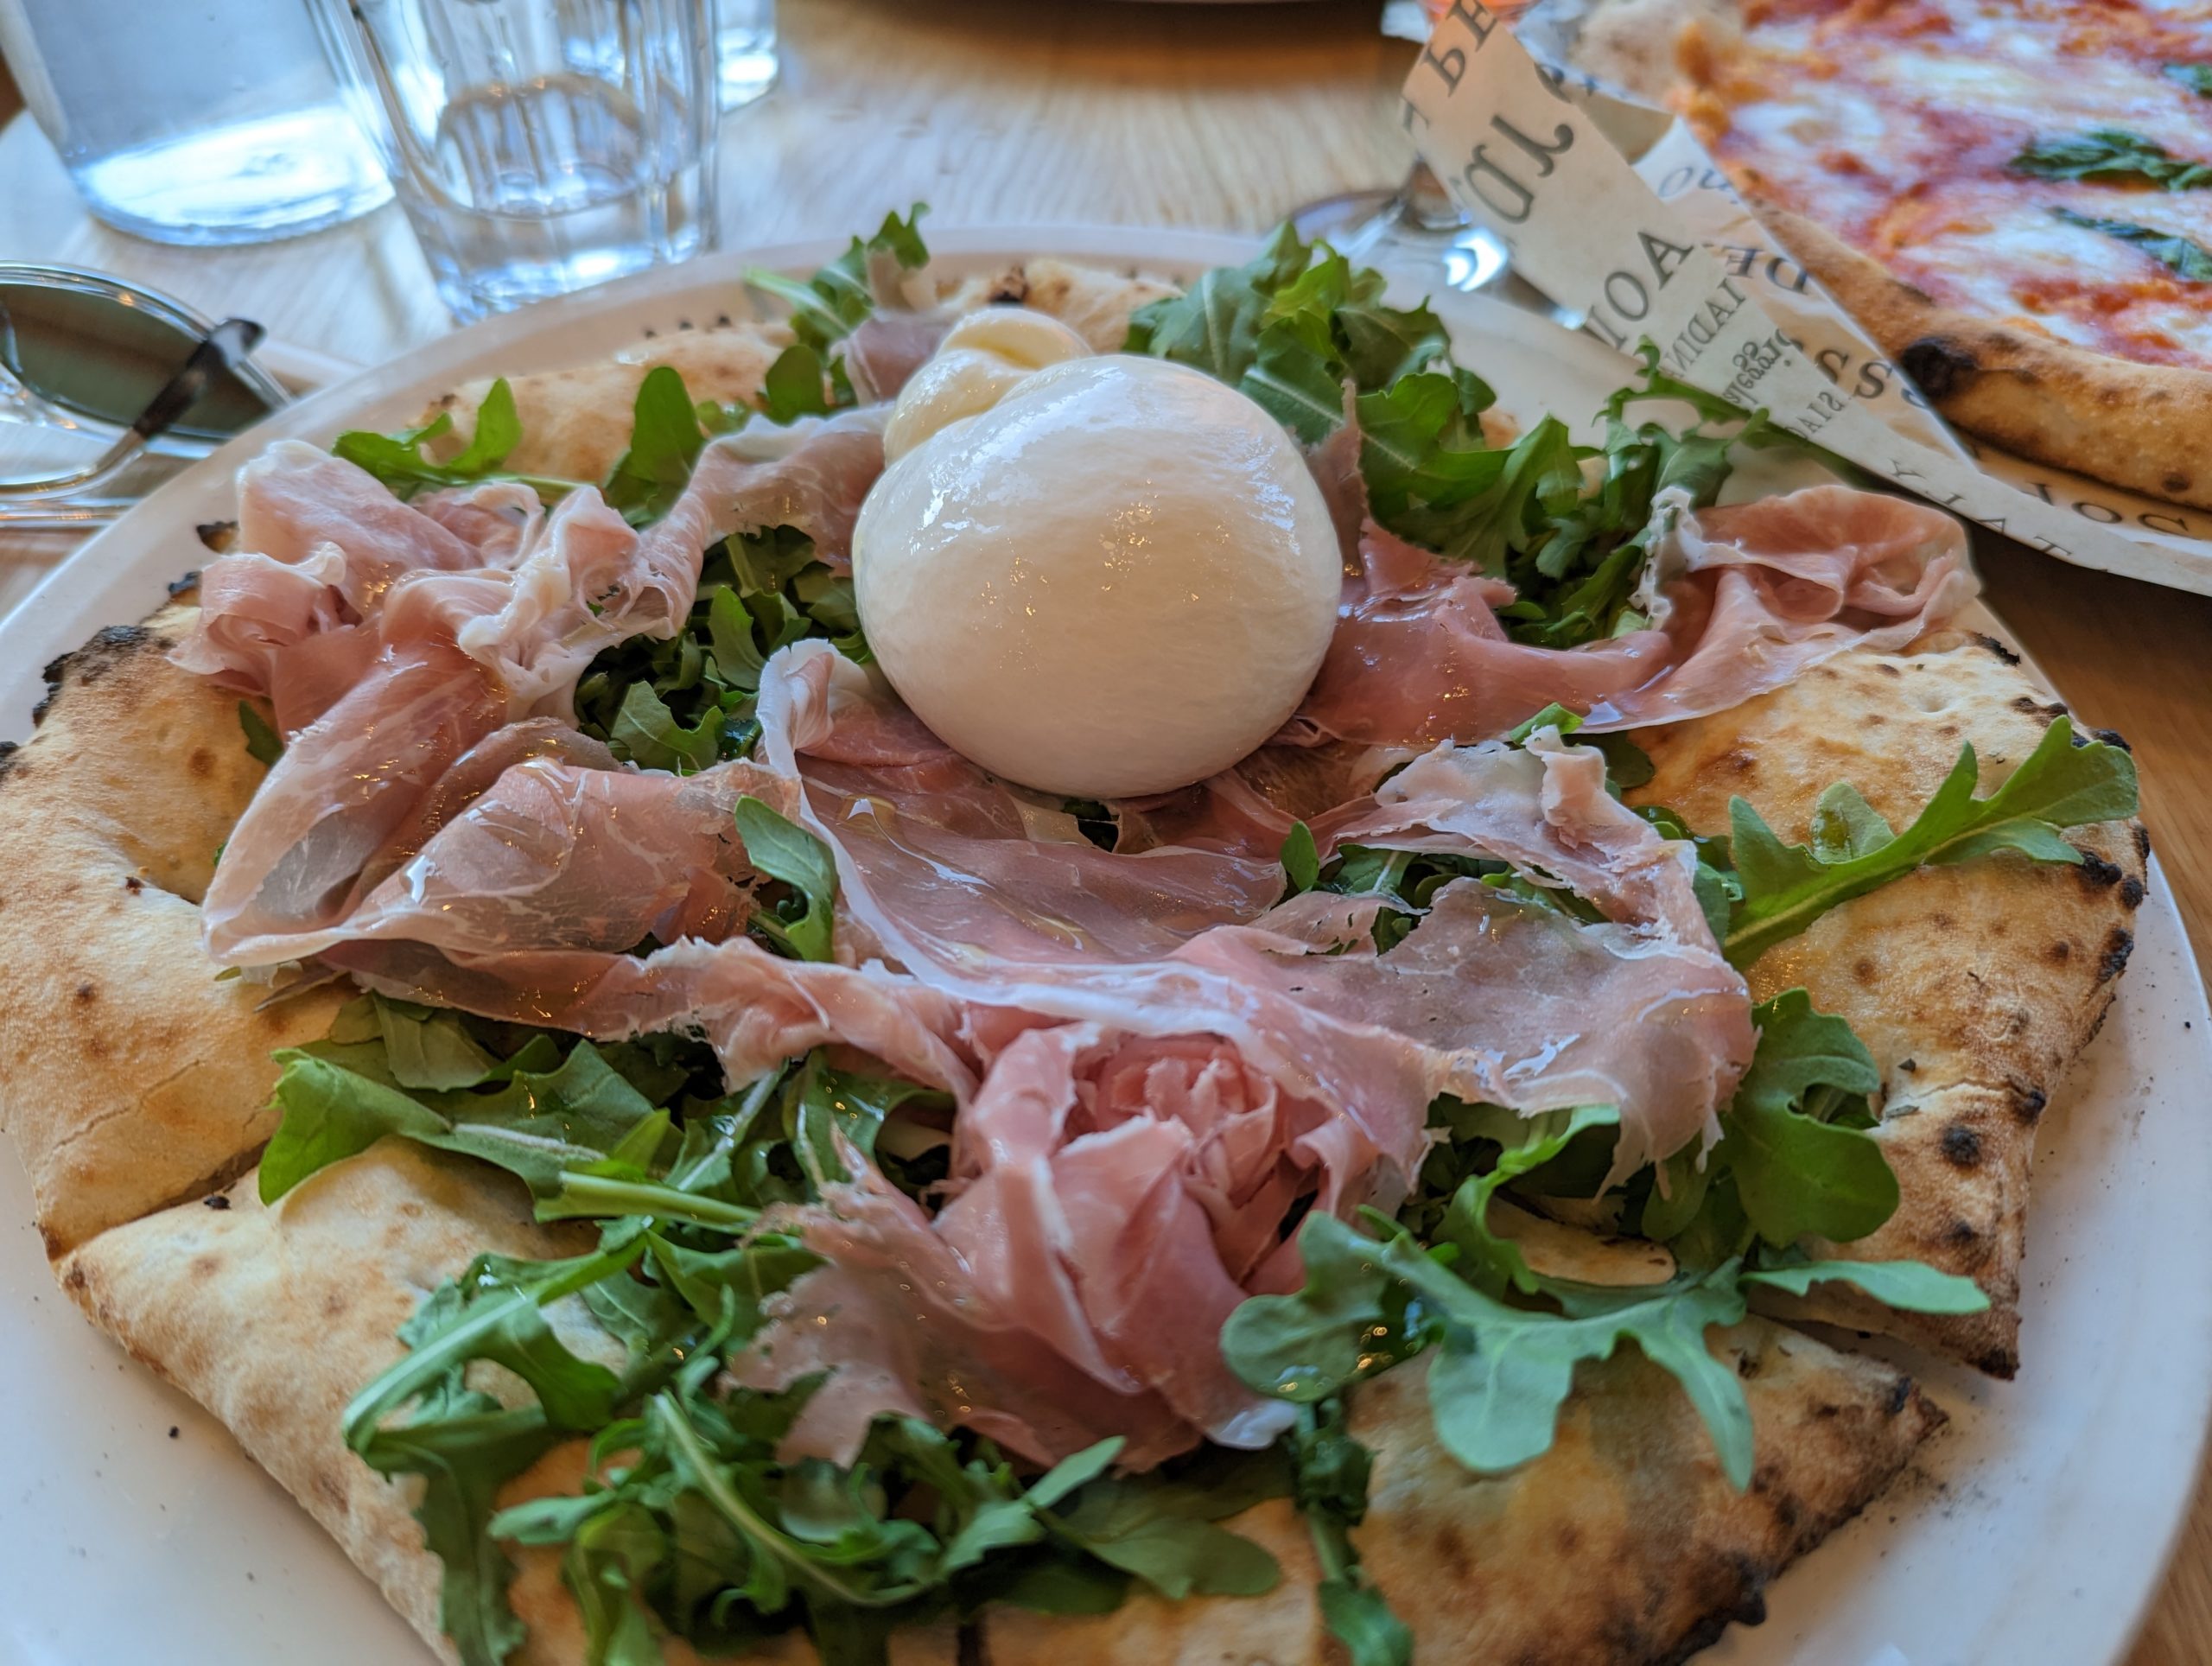
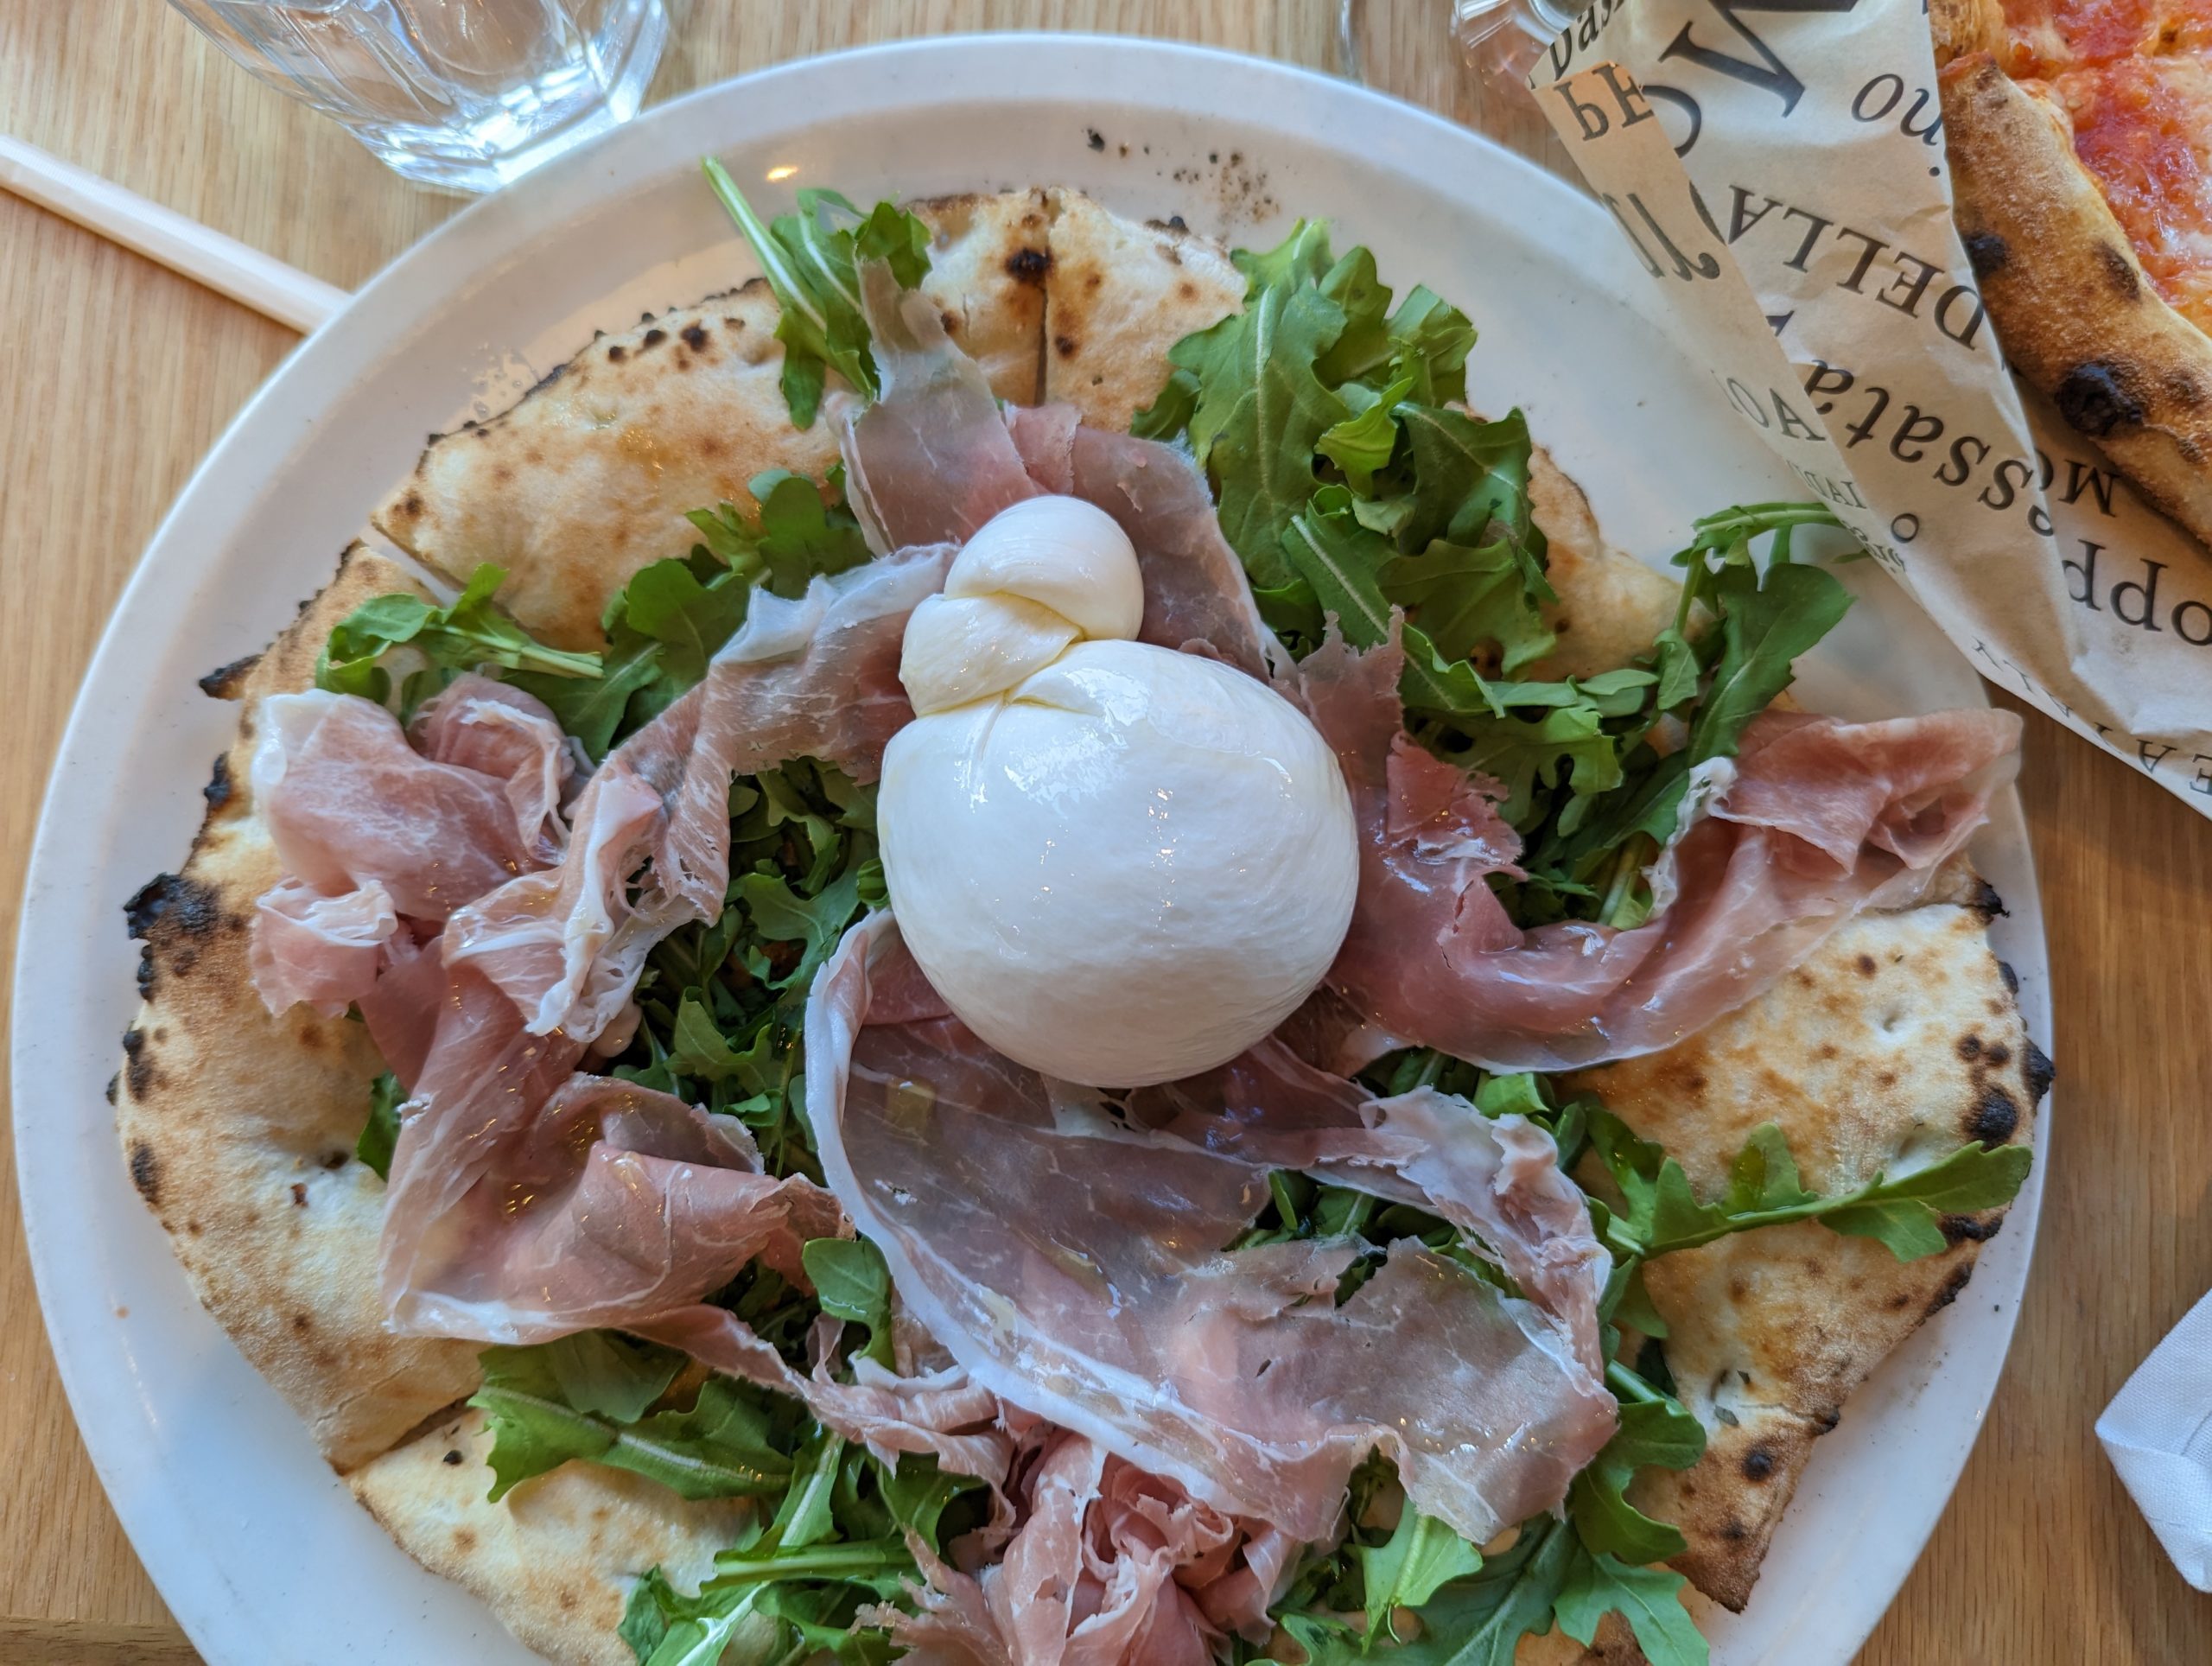
Burrata
The burrata is phenomenal. If you don’t like burrata, I feel sorry for you. How could you not love a mouthful of fluffy juicy deliciousness? Get your ass to an Eataly.
The Rovagnati prosciutto is savory and light, it almost melts in your mouth. 18th-month aged & DOP verified? Yes please. It is a perfect counterpart to the burrata. I’ve become accustomed to these sauceless pies comprised of fresh ingredients atop alluringly airy crusts. What a beautiful life.
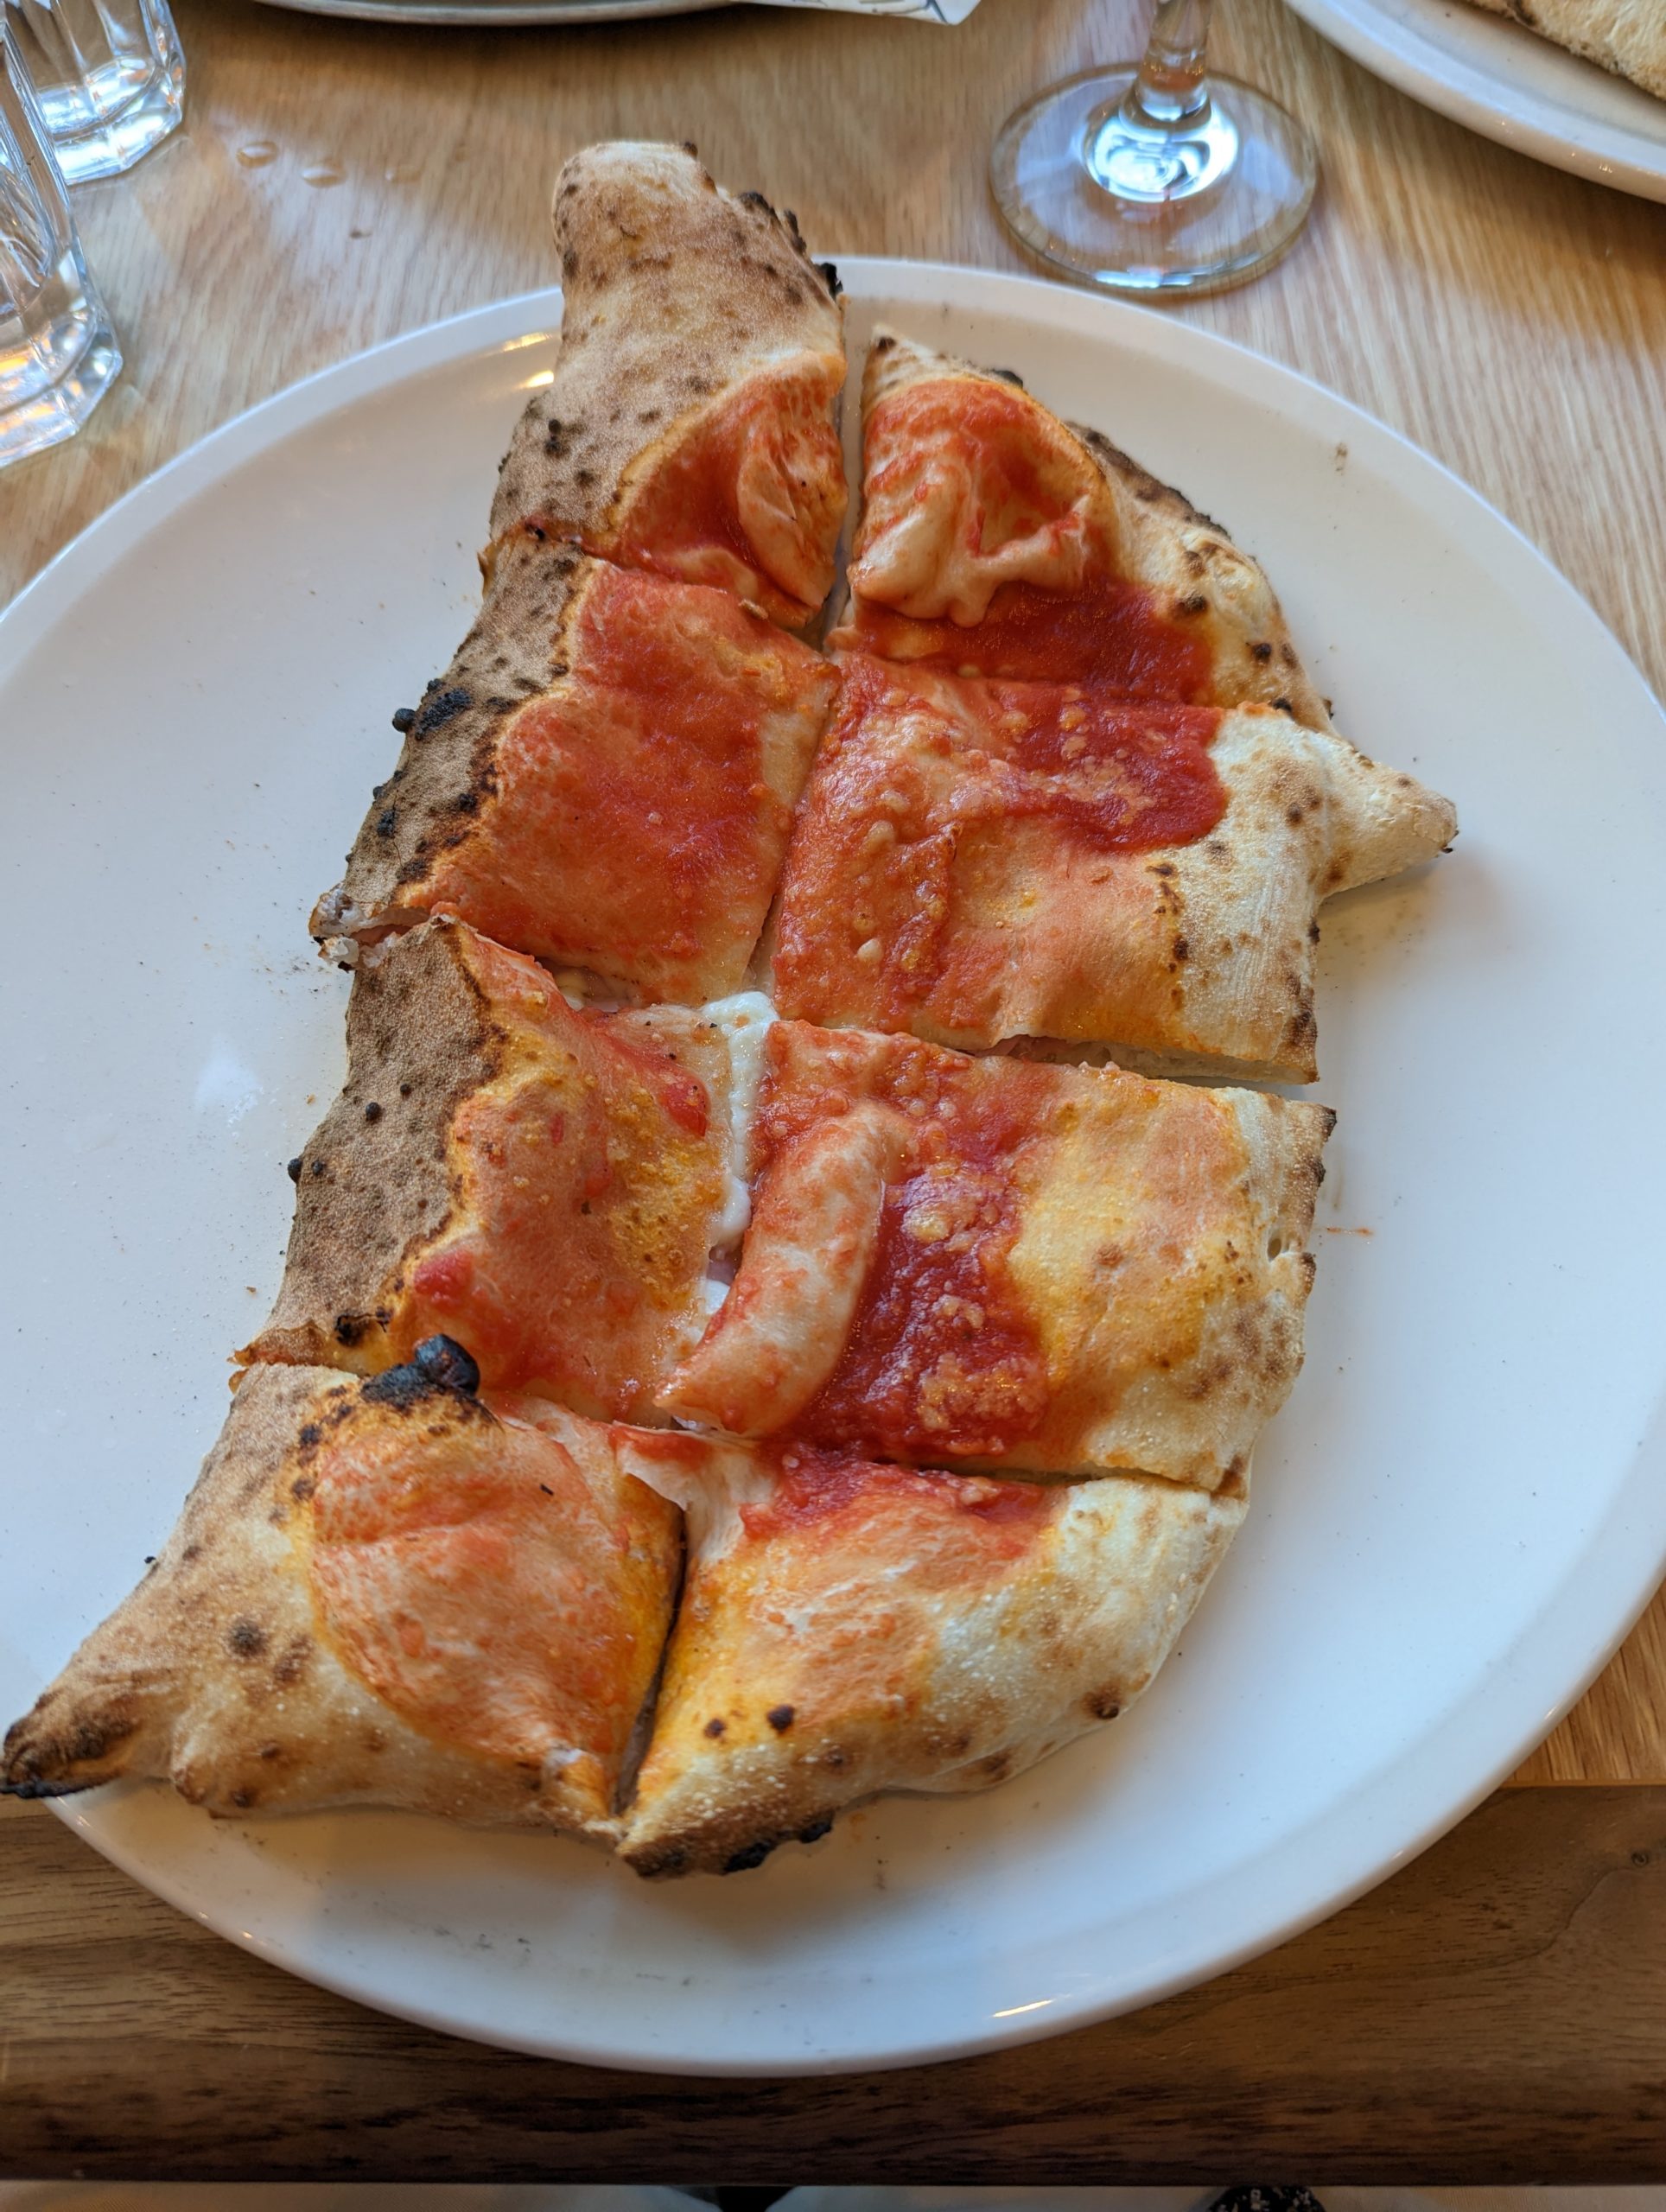
Calzone
(San Marzano Tomato Sauce, Buffalo Mozzarella, Ricotta, Rovagnati Gran Biscotto Ham, Fresh Basil, Extra Virgin Olive Oi)
Well, calzones will never be the same. A little bonus in addition to the incredible pies was something that will forever change my perception of American-produced Italian food. It was incredible. No, I will never be able to look at the local Italian restaurant calzone the same. It wasn’t fully enclosed and fried to shit. Similar to a rolled up pizza, it was filled with wonderfully fresh ingredients. It was like a savory pillow with ham and cheese packed in it, draped with a veil of simplistically sweet sauce.
Result
Okay, Eataly is amazing, and sold me the best pizza I’ve ever had. Their margherita is so well prepared, balanced, and fresh, that it has to be the best Neapolitan I’ve ever eaten. Clear winner of The Ultimate LA Pizza Tour. I’m excited to go to Eataly when I visit New York to have it again.
Pizzeria Mozza (Los Angeles, CA)
The Ultimate Los Angeles Pizza Tour - Curated by Alessandra
∙ MARGHERITA (Mozzarella di bufala, tomato, basil) ∙
The second stop on The Ultimate LA Pizza Tour was seriously cheated given its placement in line. After eating 5 pizzas about 7 hours before, neither of us were hungry. I absolutely love pizza, and as excited as I was for this restaurant, I was not interested in eating more pizza. We geared up for the visit by watching the Chef’s Table episode featuring Nancy Silverton. Known for her bread-making skills, I had high expectations for a killer crust on their margherita. Let me tell you, the pizza did not cease to impress.
Magherita
The sauce and dough are the stars of the pie. That’s not to say that the buffalo mozzarella wasn’t amazing. We cheated with the mozza caprese to start. The salad showed the true mozzarella potential before we even got to the pizza. Better be good if it’s the name of your restaurant.
Imagine biting into a cloud that easily disintegrates as you chew – the dream every mattress retailer ever tried to sell you. Your mouth is making love to an ephemeral crust. Easily digestible doesn’t even begin to cover it, I could eat 5 of these pies and go for a run. It may be one of the most impressively prepared pizza crusts I’ve had. It is absolutely no surprise that Pizzeria Mozza lived up to the carb hype and absolutely aced the crust test.
My love got the Funghi Misti – fontina, taleggio, & thyme. I don’t like white pizzas, and I don’t like mushrooms. This would’ve never worked for me. Sure is pretty though. I guess the pizza is too.
B-Side Pizza - Hotel Ziggy (West Hollywood, CA)
The Ultimate Los Angeles Pizza Tour - Curated by Alessandra
∙ BBQ CHICKEN PIZZA (bbq chicken, crispy shallots, bbq sauce, hot honey and buttermilk ranch) ∙ CACIO E PEPE PIZZA (pecorino, parmesan reggiano, fresh mozzerella, cracked black pepper, olive oil, finished with arugula dressed with lemon vinaigrette) ∙ CALABRESE (red sauce, spicy calabrese ham, fresno chilies, fresh mozzarella, pecorino romano) ∙ MEAT LOVERS (red sauce, shredded mozzarella, fresh mozzarella, italian sausage, pepperoni, meatballs, bacon) ∙ WHITE PIZZA (shredded mozzarella, scallop potato, garlic confit, fresh mozzarella, chopped parmesan cheese) ∙
The first stop on The Ultimate LA Pizza Tour, curated by my love. I’ve never been a huge fan of LA, but my Italian guide had selected some of the best spots for pizza. We did not expect to begin the 4 stop tour in 2 days with 5 pies. At the hotel we were staying, there just so happened to be a pizza restaurant on-site.
Nothing but praise and gratitude for the Hotel Ziggy team, who put on an absolute show to start the tour. Thank you so much for the hospitality and delightful pizza tasting experience.
The team made sure we wouldn’t miss a single element of their mastery. Boasting the best pizza in West Hollywood, they certainly showed out. Now on to the pies:
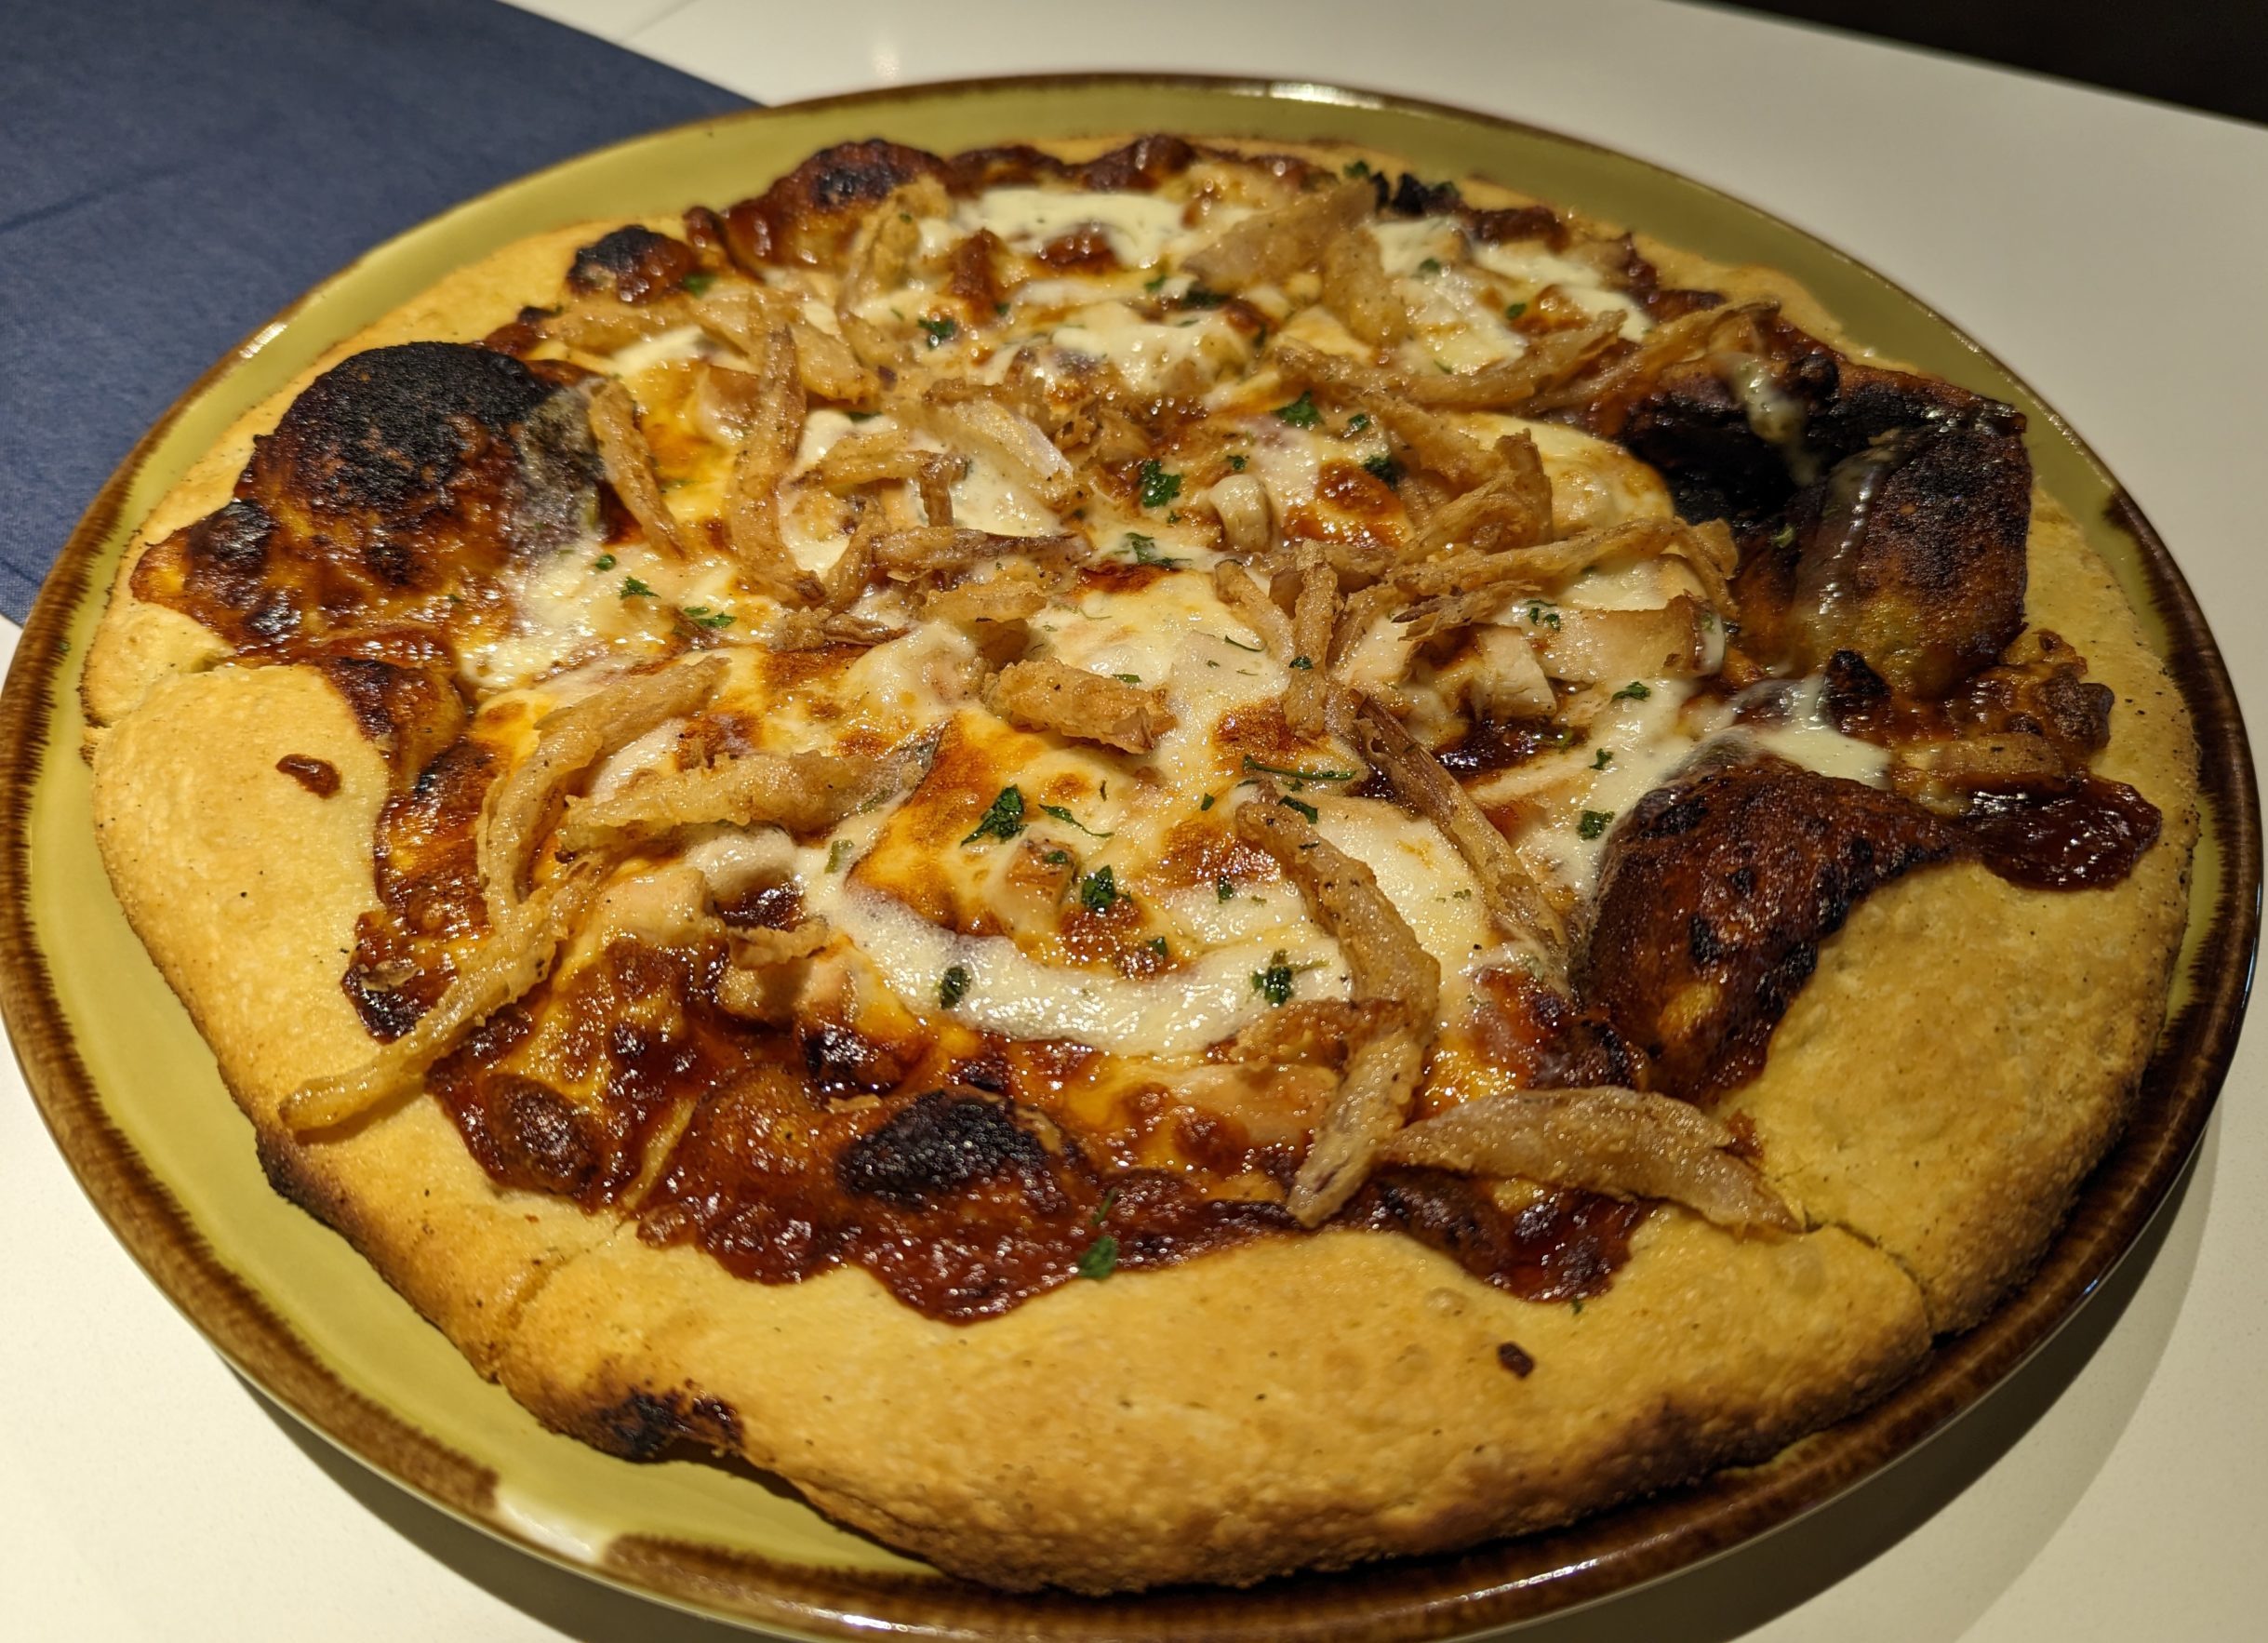
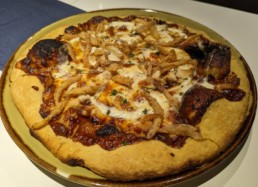
BBQ Chicken
Amazing. As my love said, this is the pizza you visit a restaurant for. I am so pleasantly surprised. I typically avoid BBQ sauce bases (given how dominant the flavor can be), yet I’m so happy I didn’t miss out here. The sauce isn’t overpowering at all – lightly tangy & gracefully smooth. I love hot honey – a fantastic addition that only highlights the sauce instead of making it too sweet. The pie is incredible. The onions…wow – the fried onions provide the tender succulent umami crunch you crave. The dough is a bit thick, somewhat bready, but not stale whatsoever. If nothing else, it feels necessary to support such a serious serving. The chicken is juicy and tender, not overcooked, nor rubbery at all. Well done by the chef. The buttermilk ranch counters the BBQ sauce so well. Again, visit Ziggy to listen to some jams and go to B-Side for the BBQ Chicken pizza.
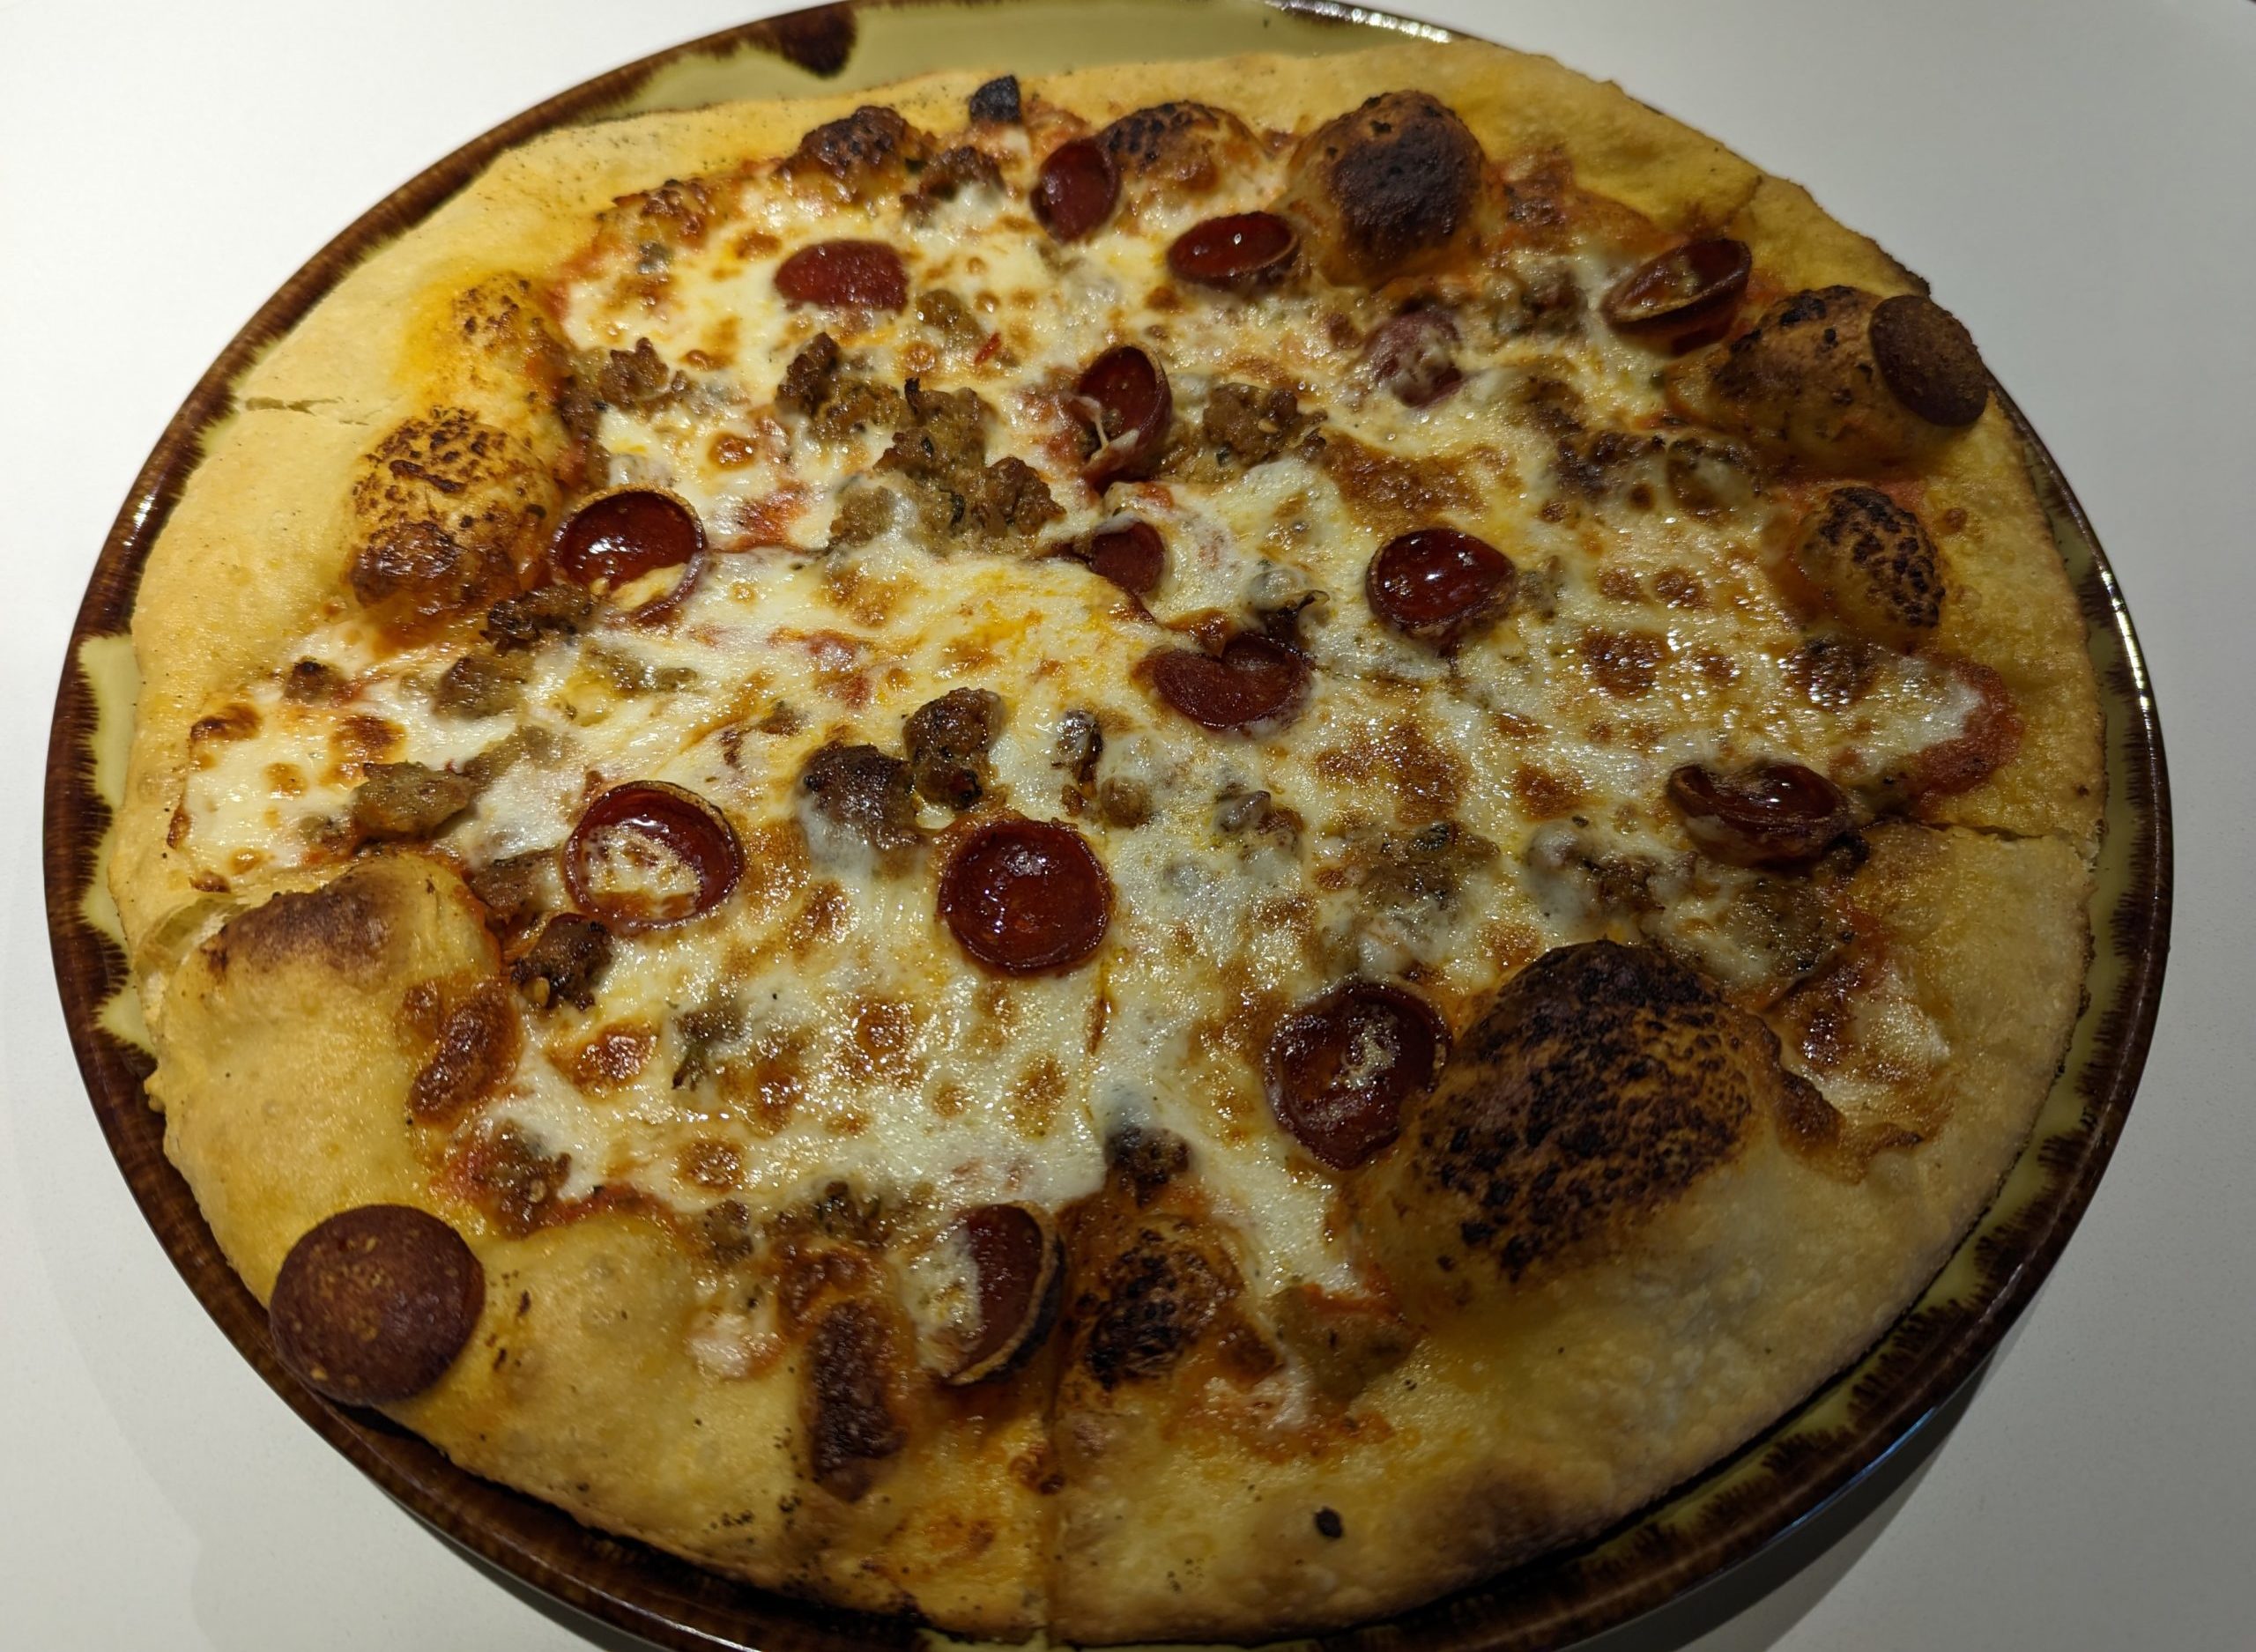
Meat Lovers
The crust is lighter and thinner. I’m a sucker for cupped pepperonis – indicative of a natural casing which shrinks faster than the ronis while cooking. The sausage is tender and kind of spicy. While the pie is cheesier than the last, it’s still great. IMO, 2nd best crust behind the cacio e pepe.
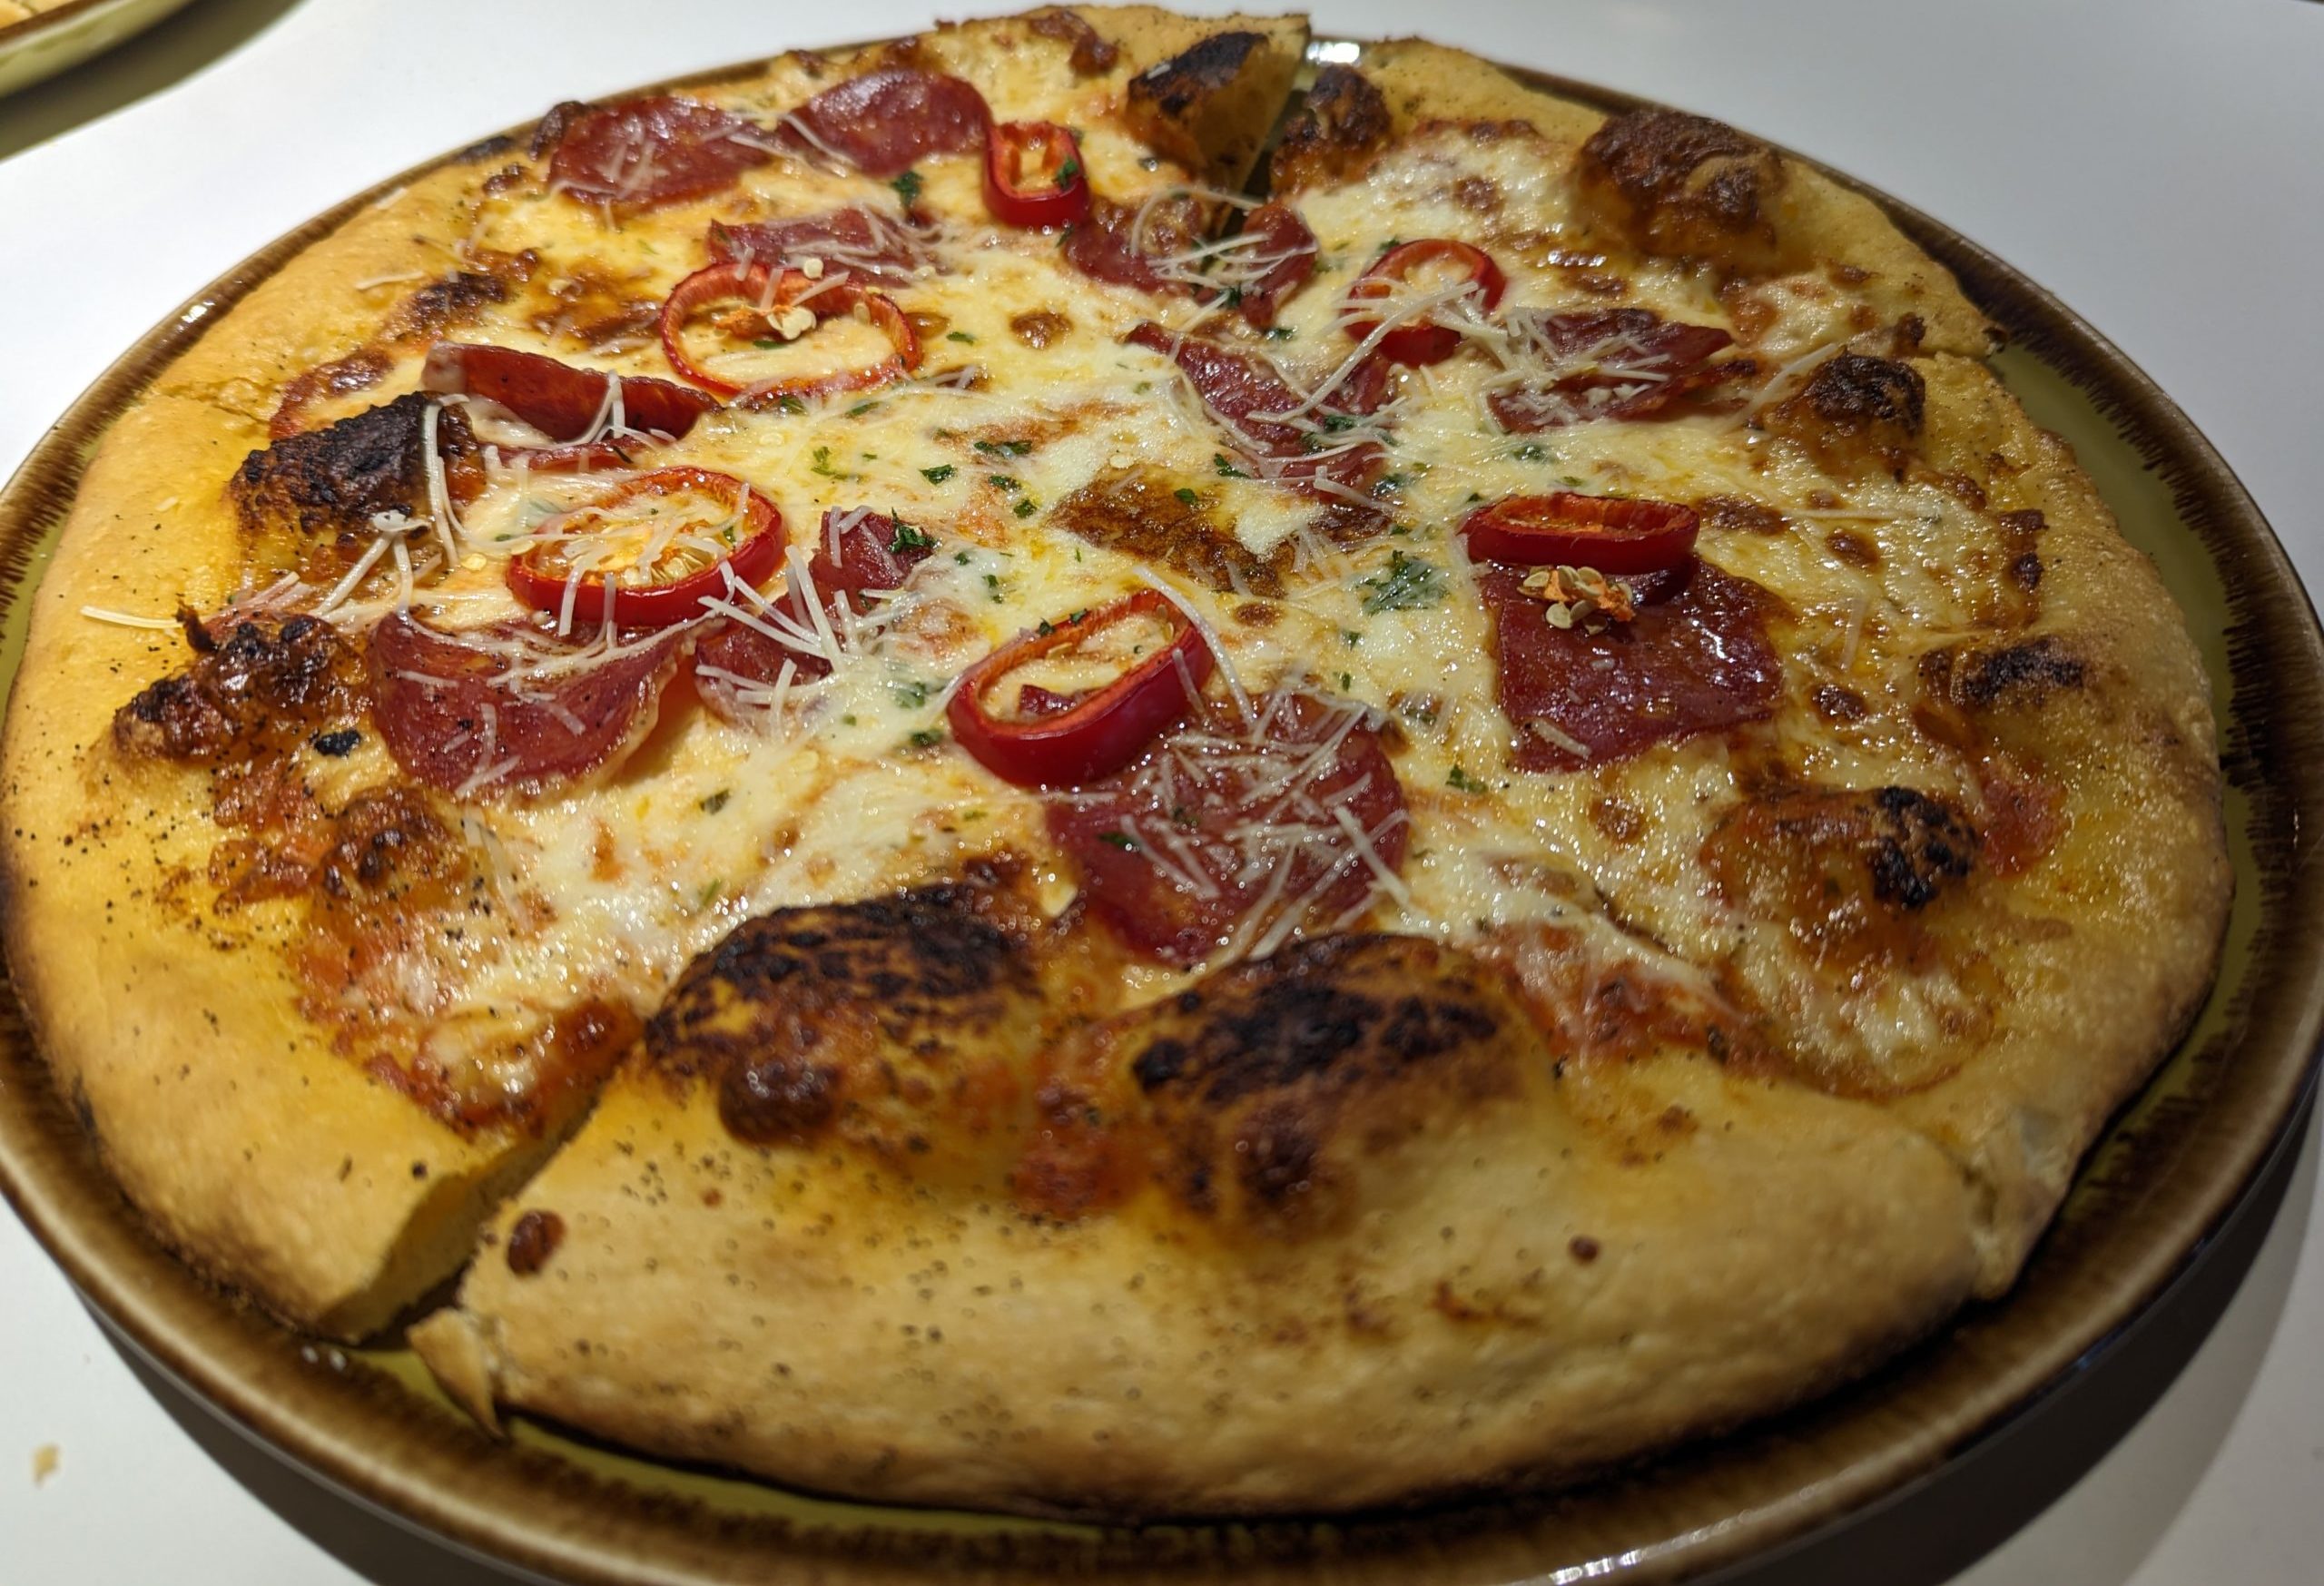
Calabrese
This pie is EN FUEGO – it will light you on fire like an avid arsonist. Fair warning to you softies – grab a glass of milk, because these chili’s don’t mess around. My lady thinks it is salami as opposed to ham, but it is great nonetheless. The pecorino is a nice touch to dull the heat – a crucial addition to the fire pie.
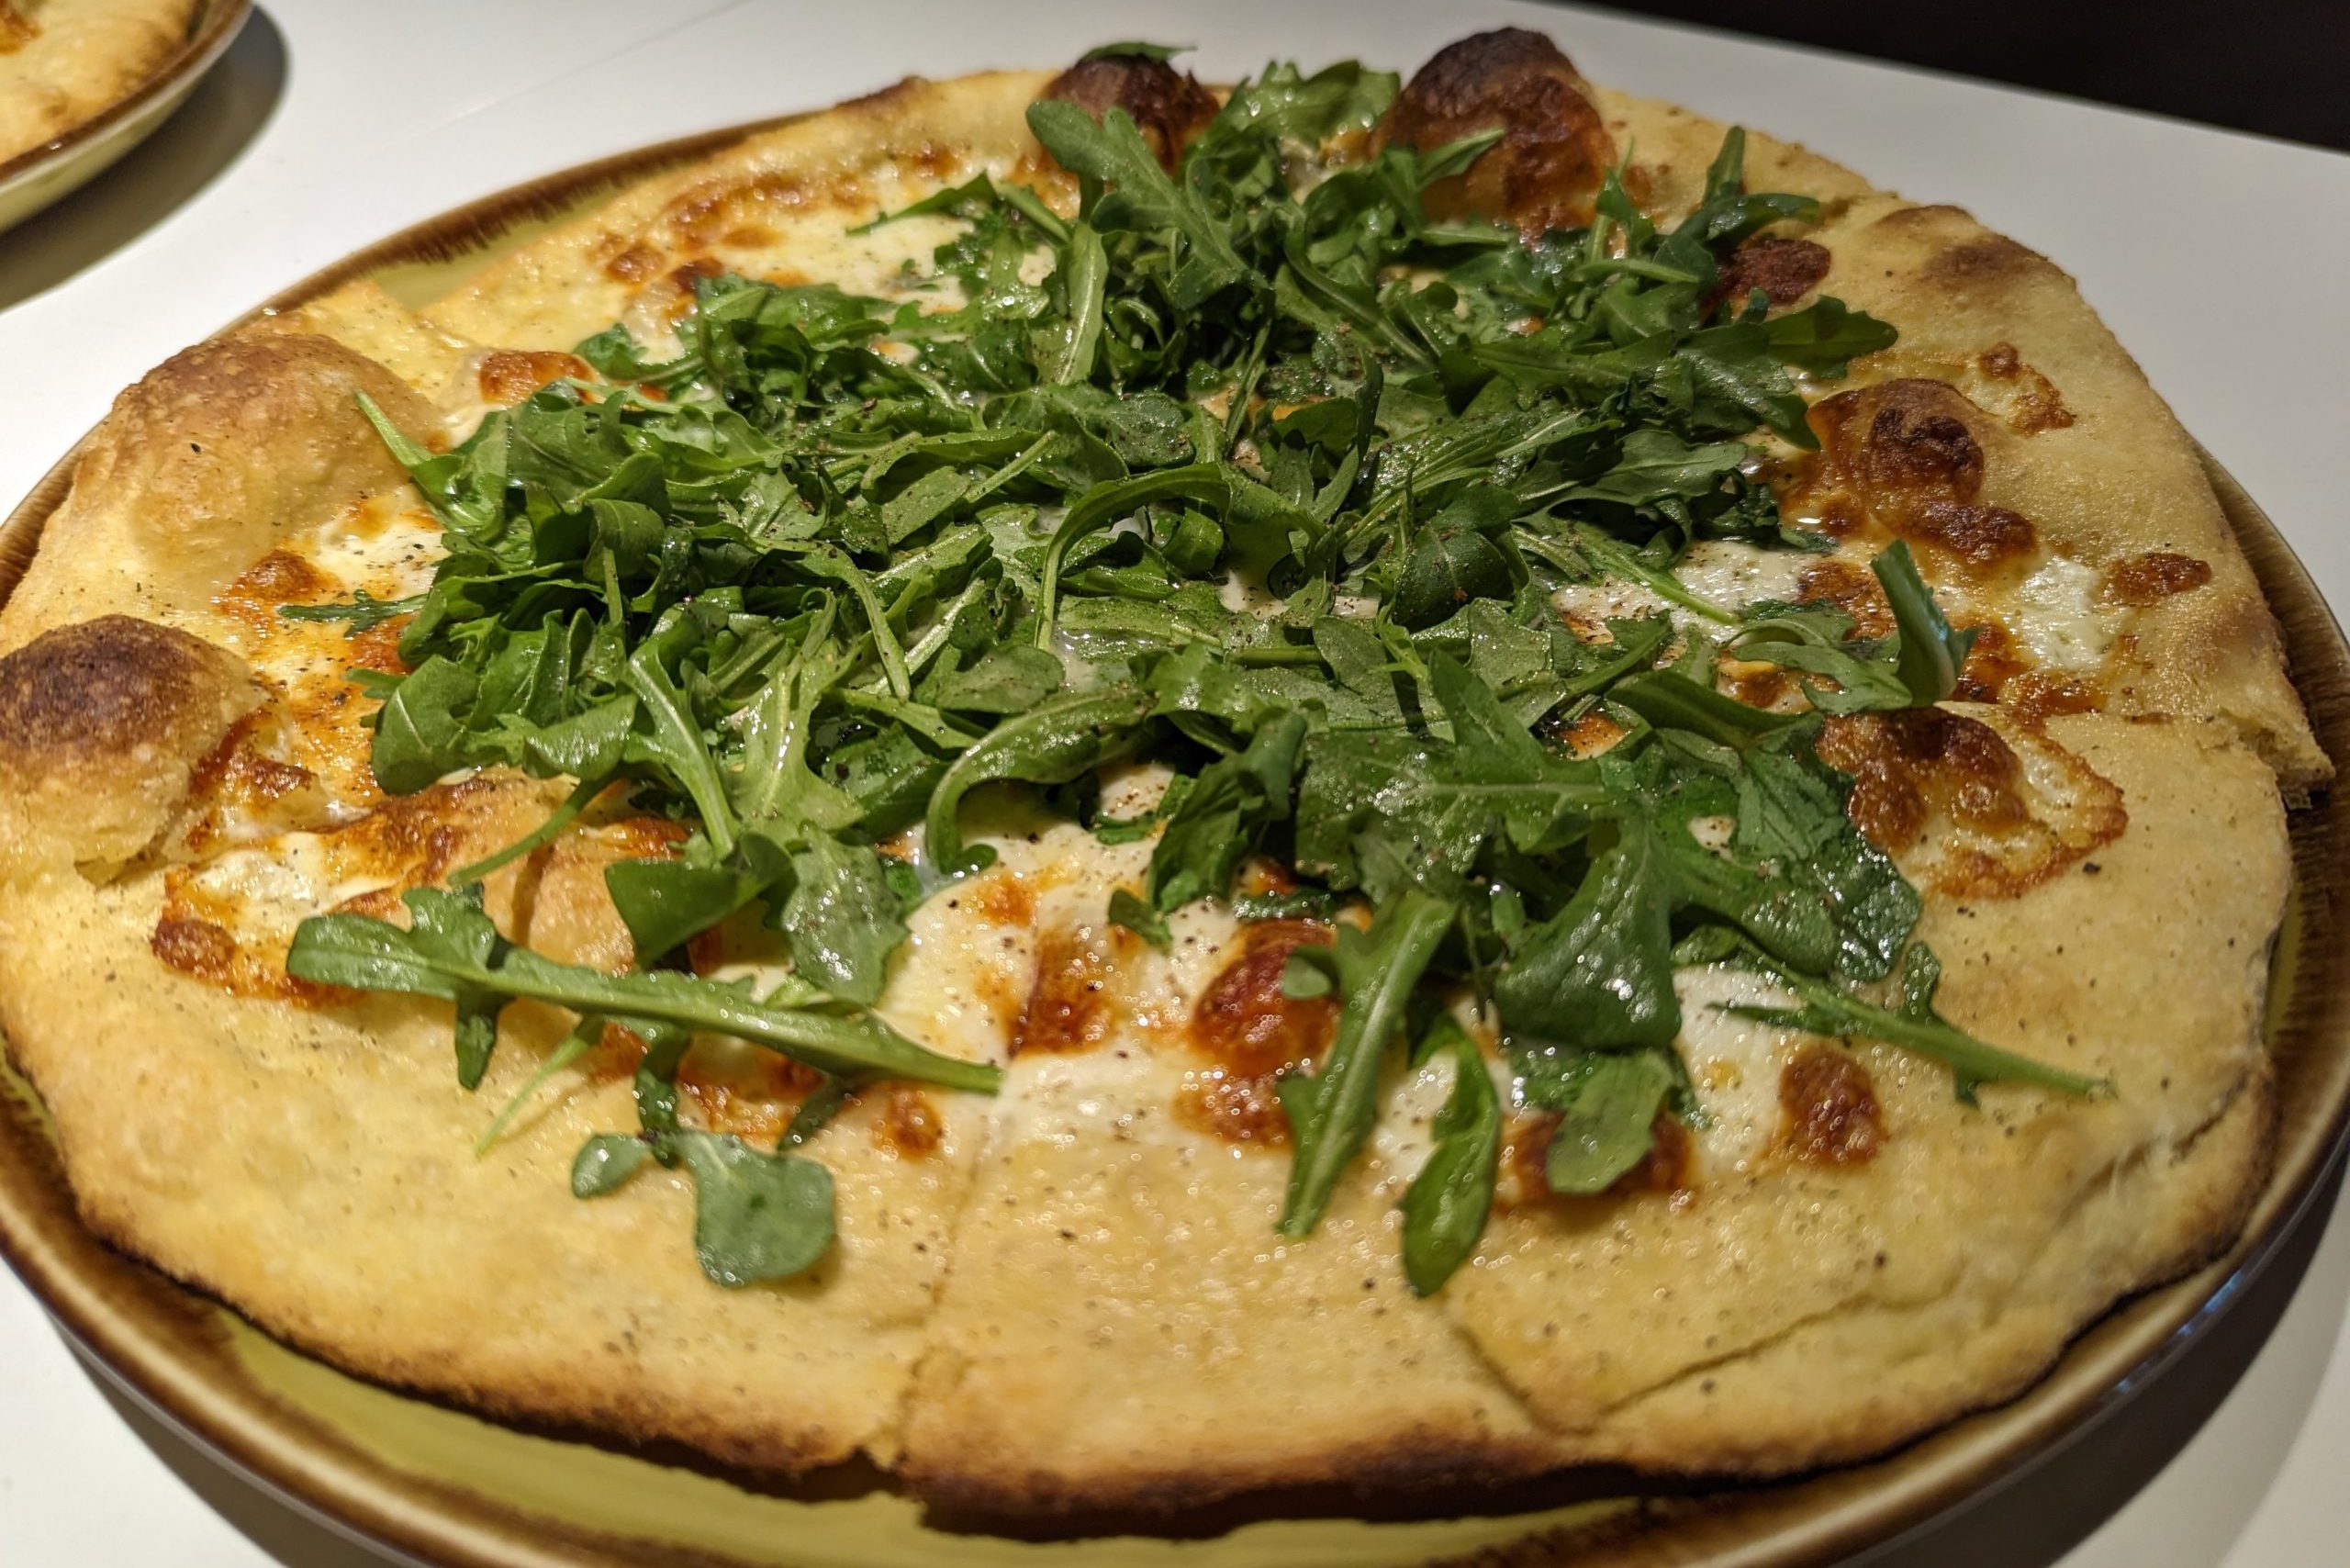
Cacio e Pepe
The lemon vinaigrette hits immediately…it is fairly distracting. That said, the zesty touch cuts the cheese nicely. Arugula is perfect for this pie – the slightly peppery ruffage gives it the natural pepe flavor. The crust is a bit crunchier than the others – the pizza let’s it shine with how subtle the flavors are. Perhaps a little less vinaigrette? Maybe I’m the one who is soft.
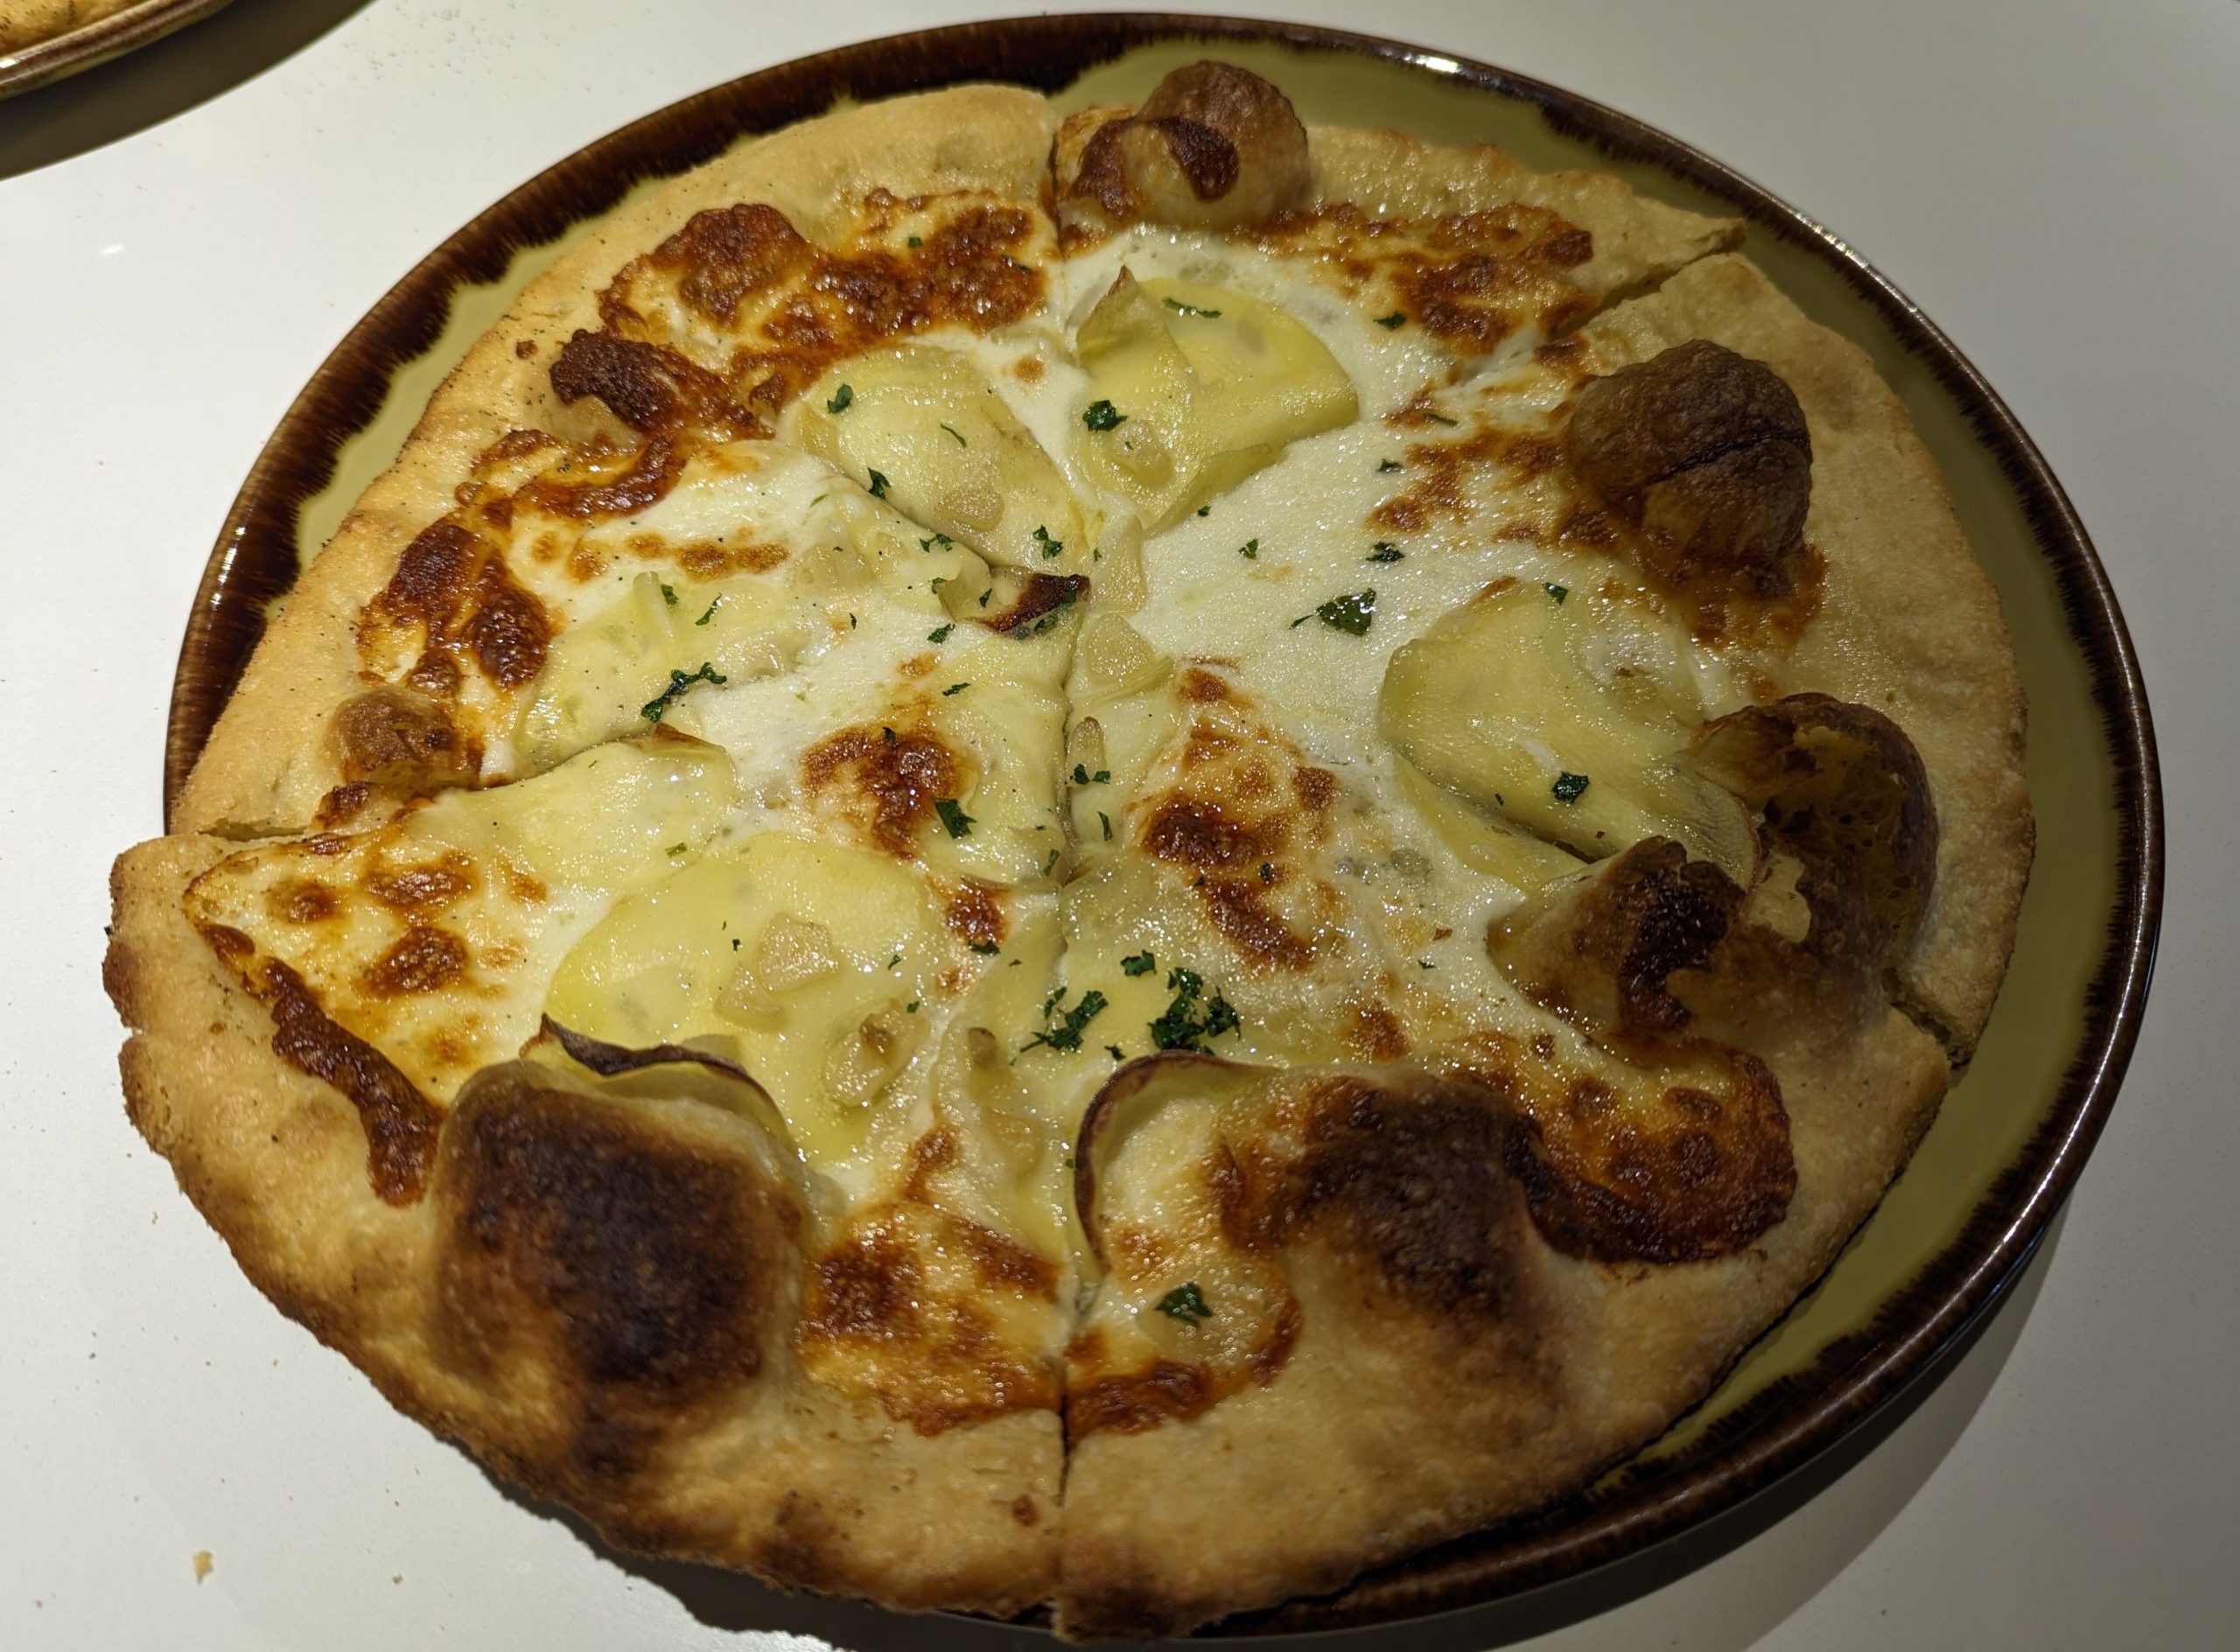
White Pizza
This pie is garlic forward. Sorry, no makeout session for you after this one. The potatoes are very creative – thinly sliced, and have a bit of a crunch following the cook. The crust with the garlic is the star here – fuck your dominoes herb crust.
Result
Don’t order five pizzas for two people. Just don’t do it. We ate the entire BBQ chicken pizza, and half of the rest. I’ve never been a white pizza guy, but it was fun to try the cacio e pepe and their white pizza. The toppings were very creative. I’m pretty good with spicy food, but the Calabrese was a little much for me. I still ate the entire half (after removing a few chilis). I don’t know if the meat lovers was just pepperoni and sausage, or if it was a different pie. Old trusty gets it done once again. Obviously the BBQ Chicken pizza is the winner.
One hell of a way to begin a pizza tour – courtesy of the fantastic team at Hotel Ziggy. Great spot. Visit for the BBQ chicken pizza!
In Bocca Al Lupo (Washington, DC)
Landslide victory for best DC pizza. One of my new favorite pizzas, right in my backyard.
∙ In Bocca Al Lupo (pomodoro, salsa verde Romana, sun dried tomatoes, pulled buffalo mozzarella), Margherita (mozzarella, pomodoro), Bresaola Rughetta e Parmigiano (thin pizza dough with bresaola, arugula and parmesan) ∙
First of all, acknowledge and appreciate if you’re being served the owner. Then bow down the new master of the DC pizza.
We started with Italian originals, beginning with a wonderful bruschetta con pomodoro. Followed by an awesome app – the suppli al telefono – named after the appearance similar to a cheesy telephone when tearing the roll in half. Followed by my new favorite thing in the world – crocchette di patate. THIS IS INCREDIBLE (google it), and phenomenally prepared, according to my beautiful Italian guide.
Before we get into the pizza – let’s differentiate. This is Roman pizza – subtly, yet greatly different from Neapolitan pizza – it hits every note I’ve ever needed. Firm, yet pliable crust supports a pizza like you’ve never seen.
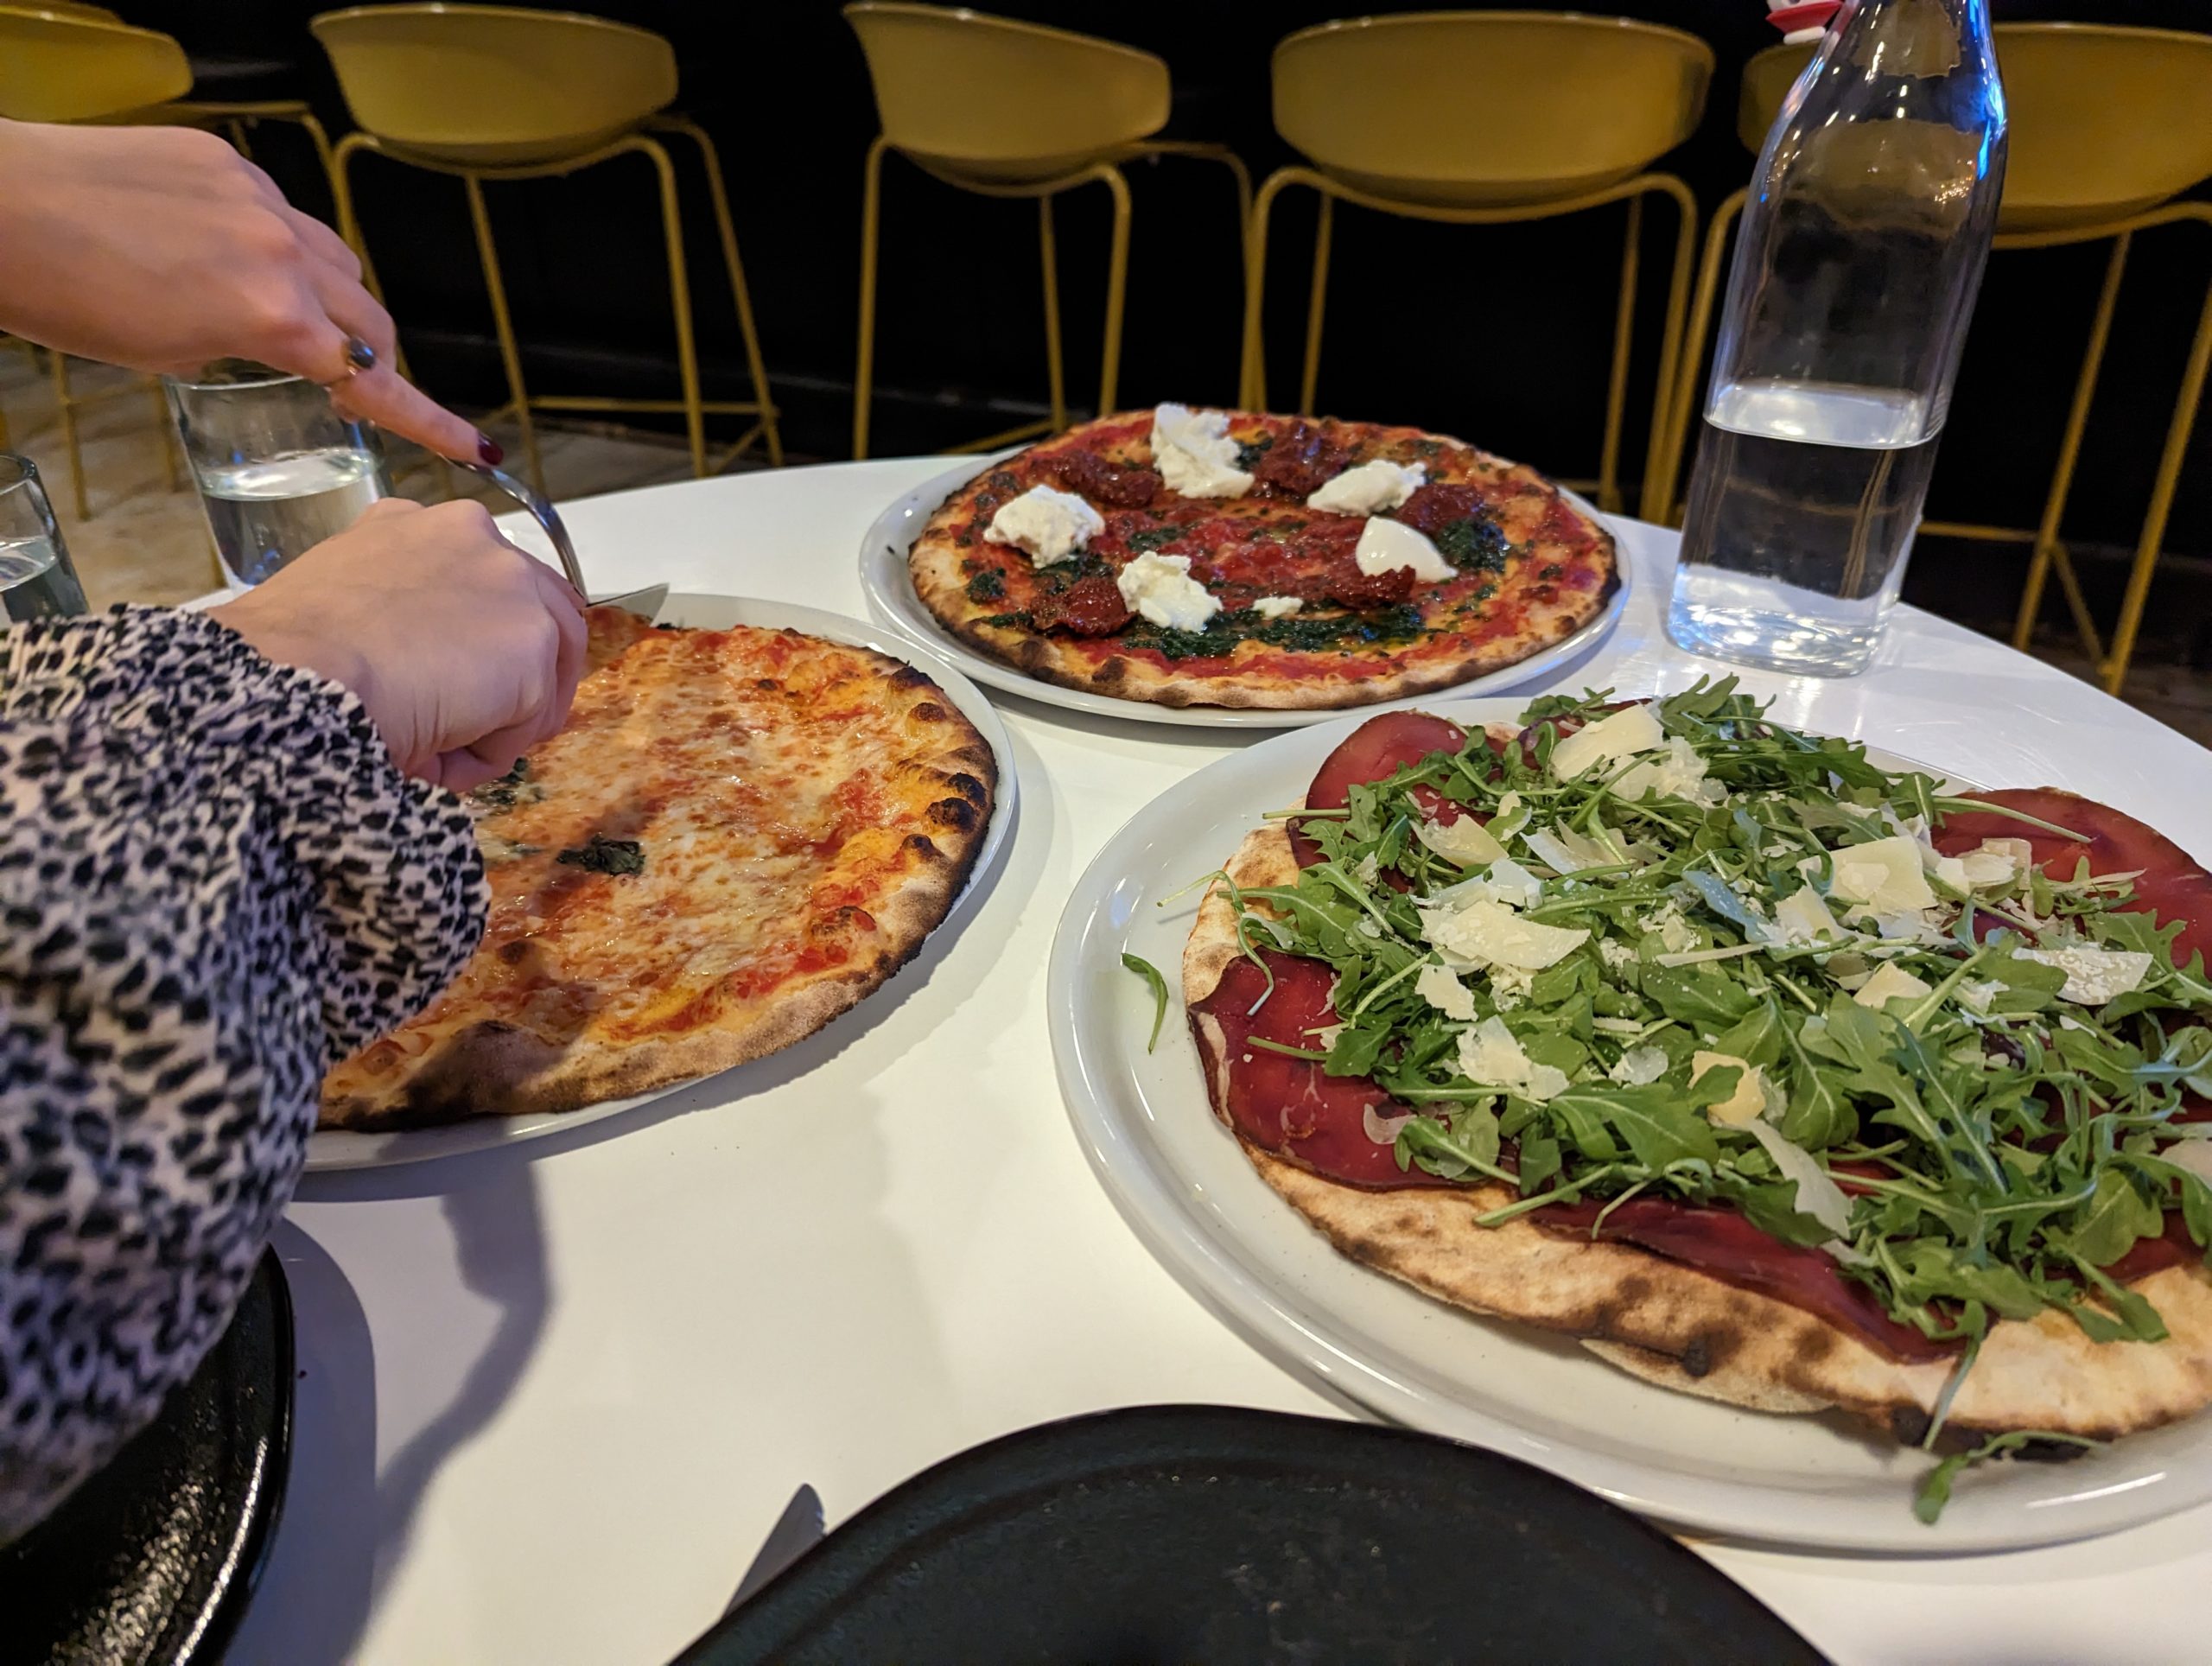

In Bocca Al Lupo
The sun dried tomatoes melt in your mouth…the first I’ve ever had that weren’t tough. The combination of the olive oil and buff mozz is to die for. Some of the best buffalo mozzarella I’ve ever had. The saltiness of the tomatoes bounces so well off of the fresh cheese. I thought I’ve had delicate sauce prior, but if you get a bite of sauce alone, you can appreciate how truly amazing it is.
We haven’t mentioned the most memorable element – salsa verde Romana – amazing. Parsley, olive oil and garlic (etc) amalgamated to create saucy bliss.
Margherita
Thin crust doesn’t even begin to cover it – despite the supremely fresh imported ingredients on top, the crust is the star of the show. The best balanced pizza ever – crust so incredibly light, yet supports the pizza better than I’ve seen prior on a margherita. It feels odd to admit that my favorite margherita isn’t Neapolitan at all, but in fact, Roman.
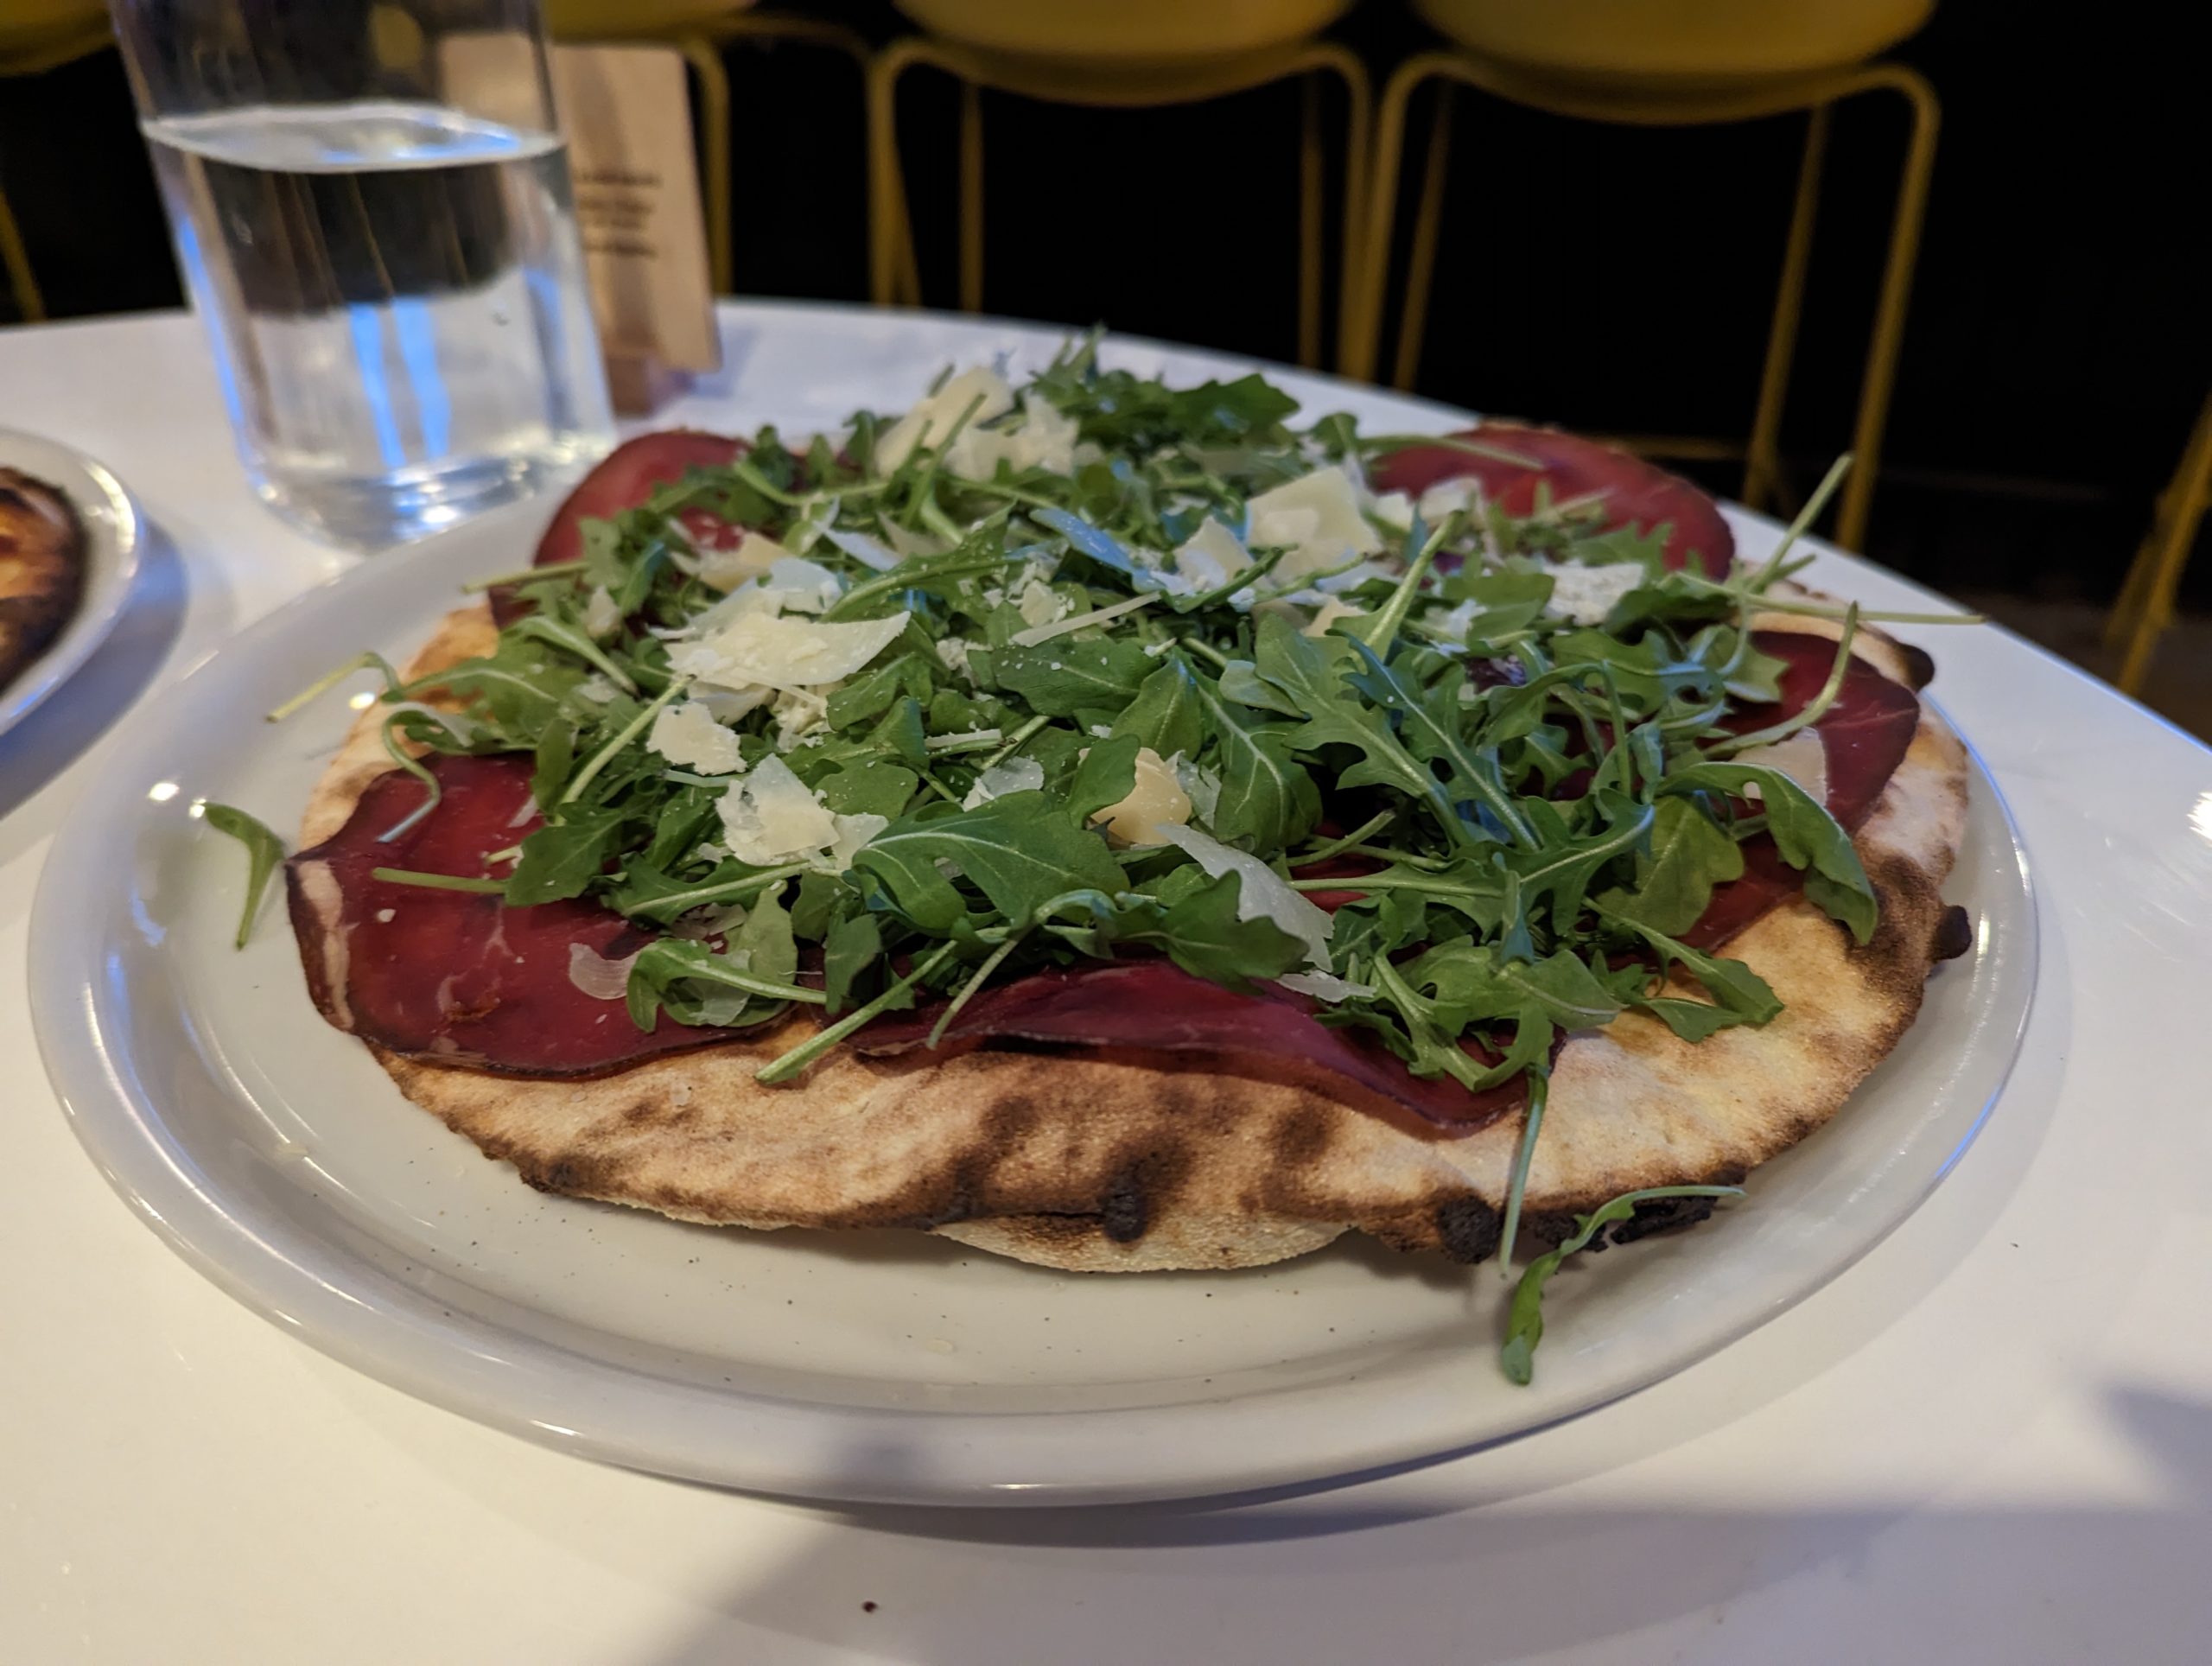
Focaccia Bresaola Rughetta e Parmiggiano
The crust floats like air. No sauce no nothing. My lady says it needs olive oil. The benefit of no sauce, oil, etc is the degree to which the airy crust shines.
The Bresaola is next level – fuck your pepperoni pizza – subtle, not too rich, and in no way fatty. It will change your mind about Italian cold cuts. The combination is beautiful – it’s effectively a simplistic, yet superior salad served on top of the finest crust you’ve ever had.

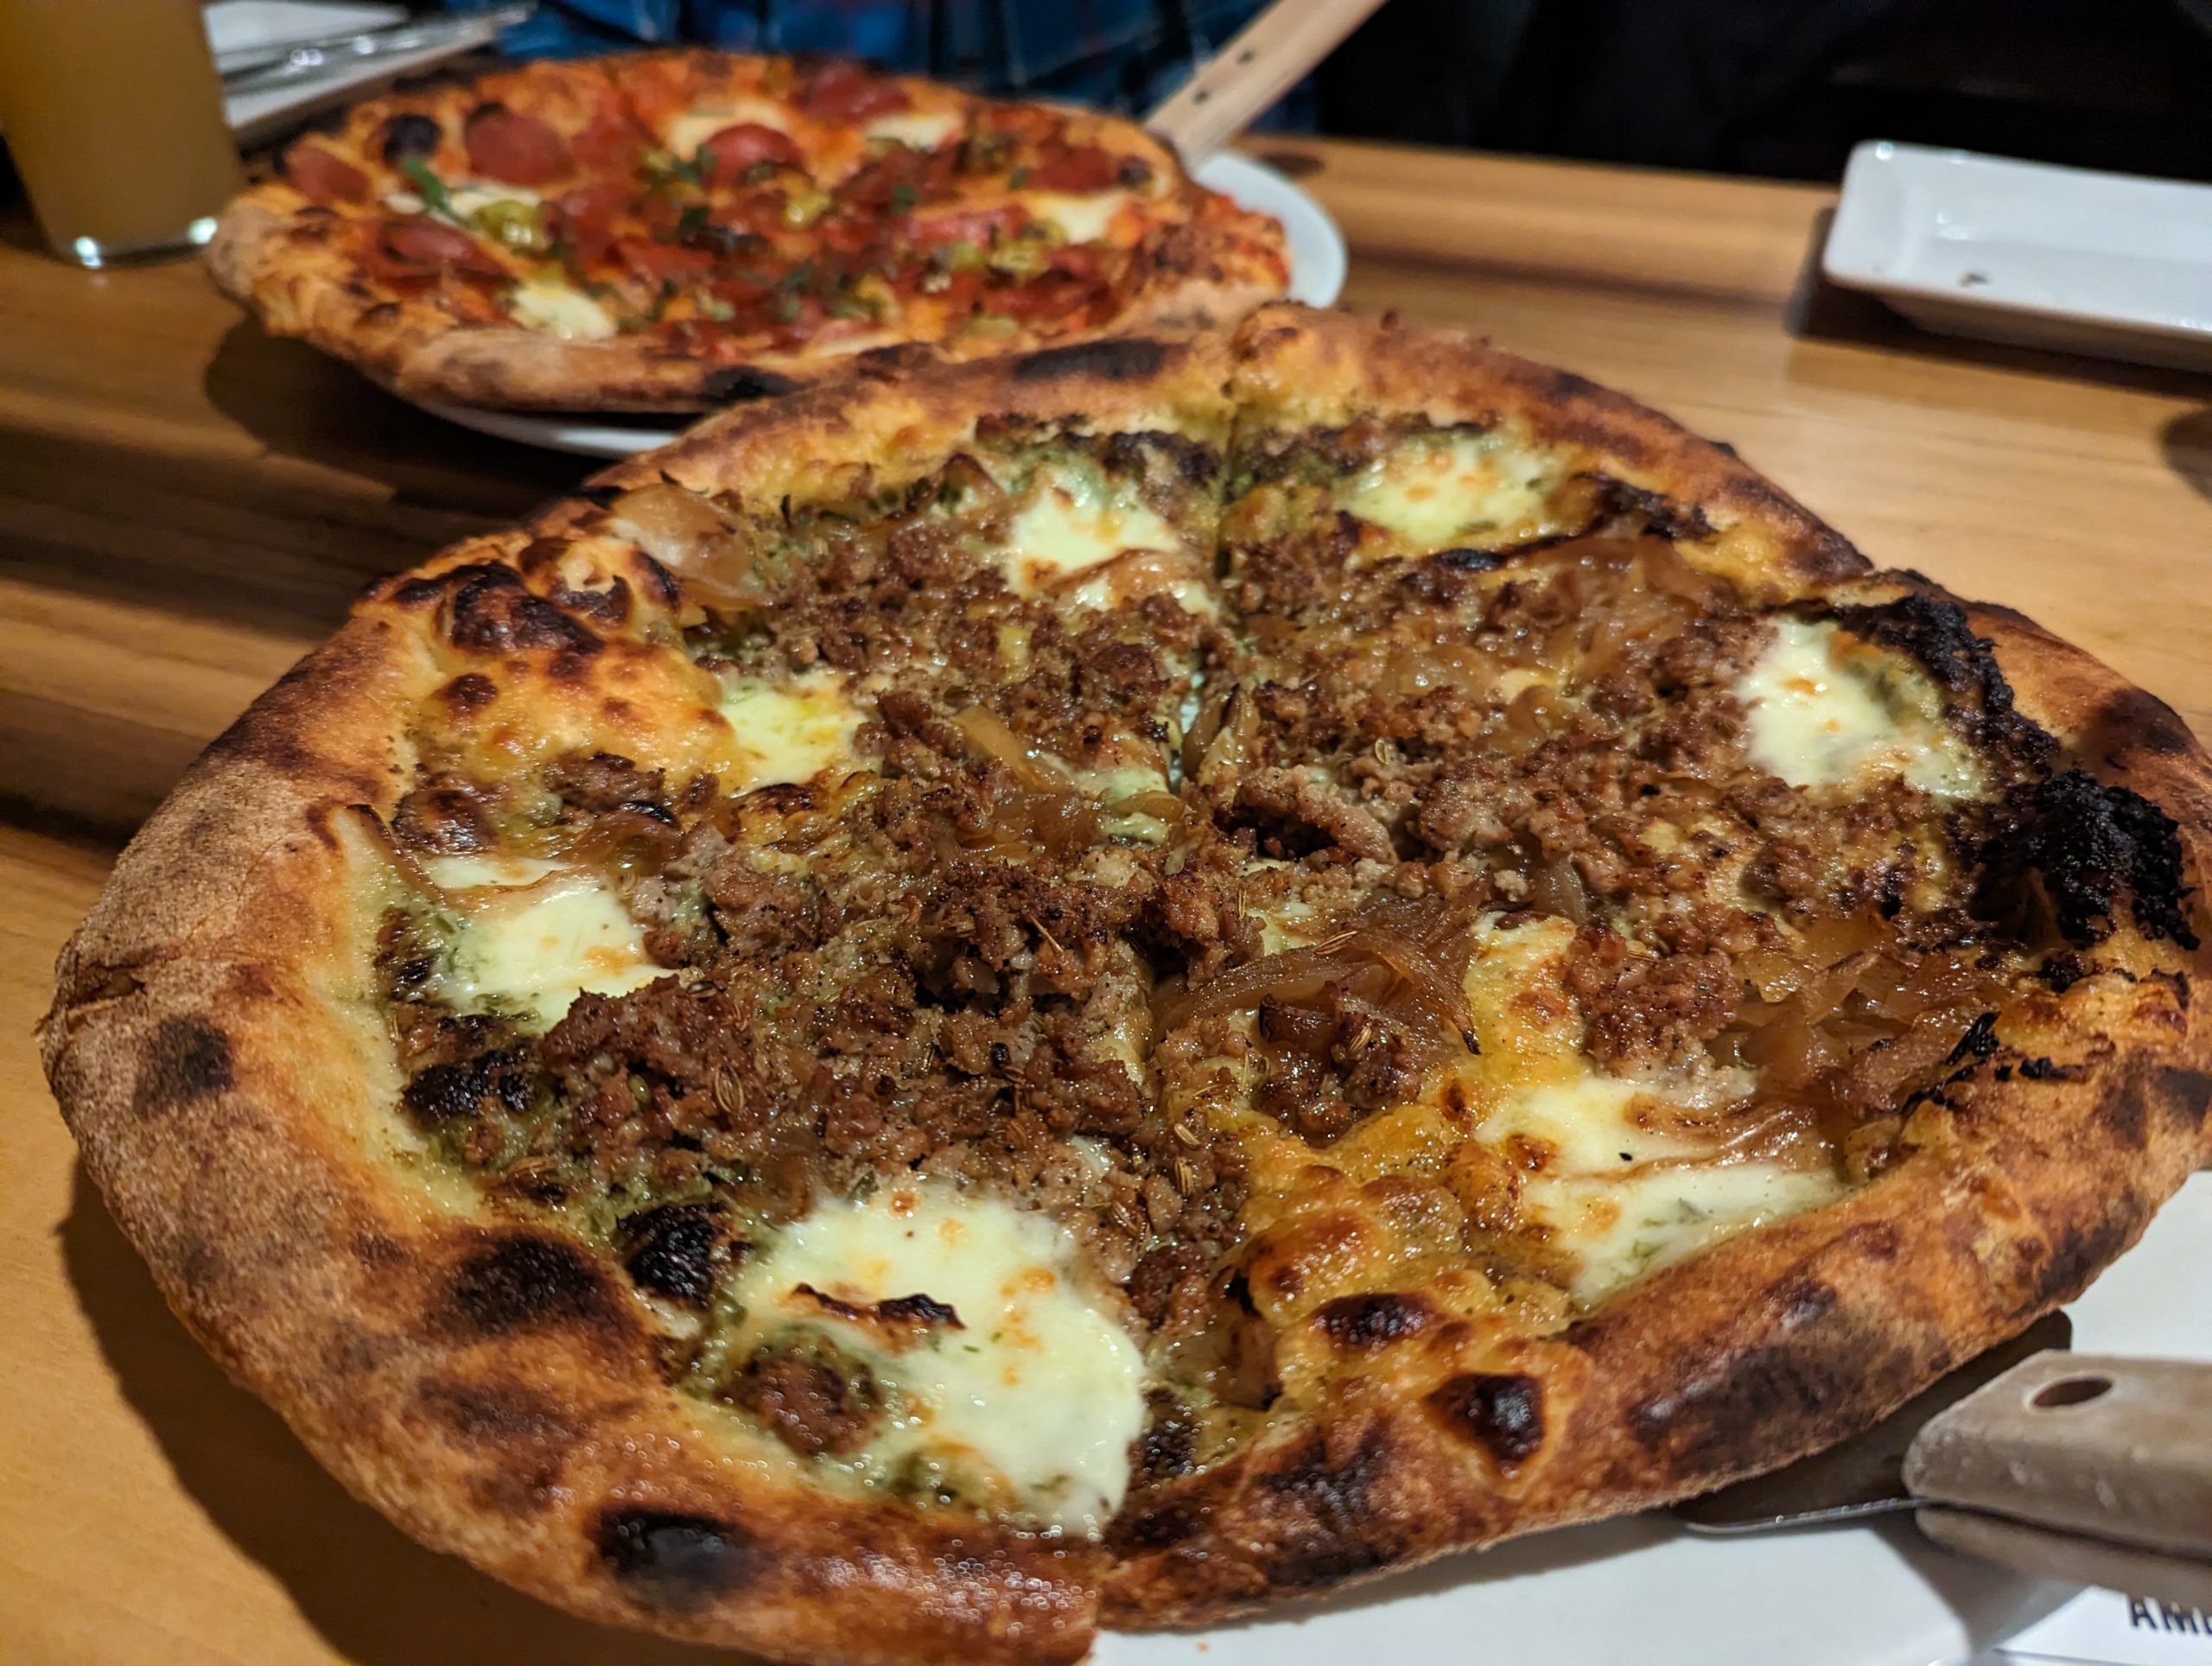
Fox's Den (Annapolis, MD)
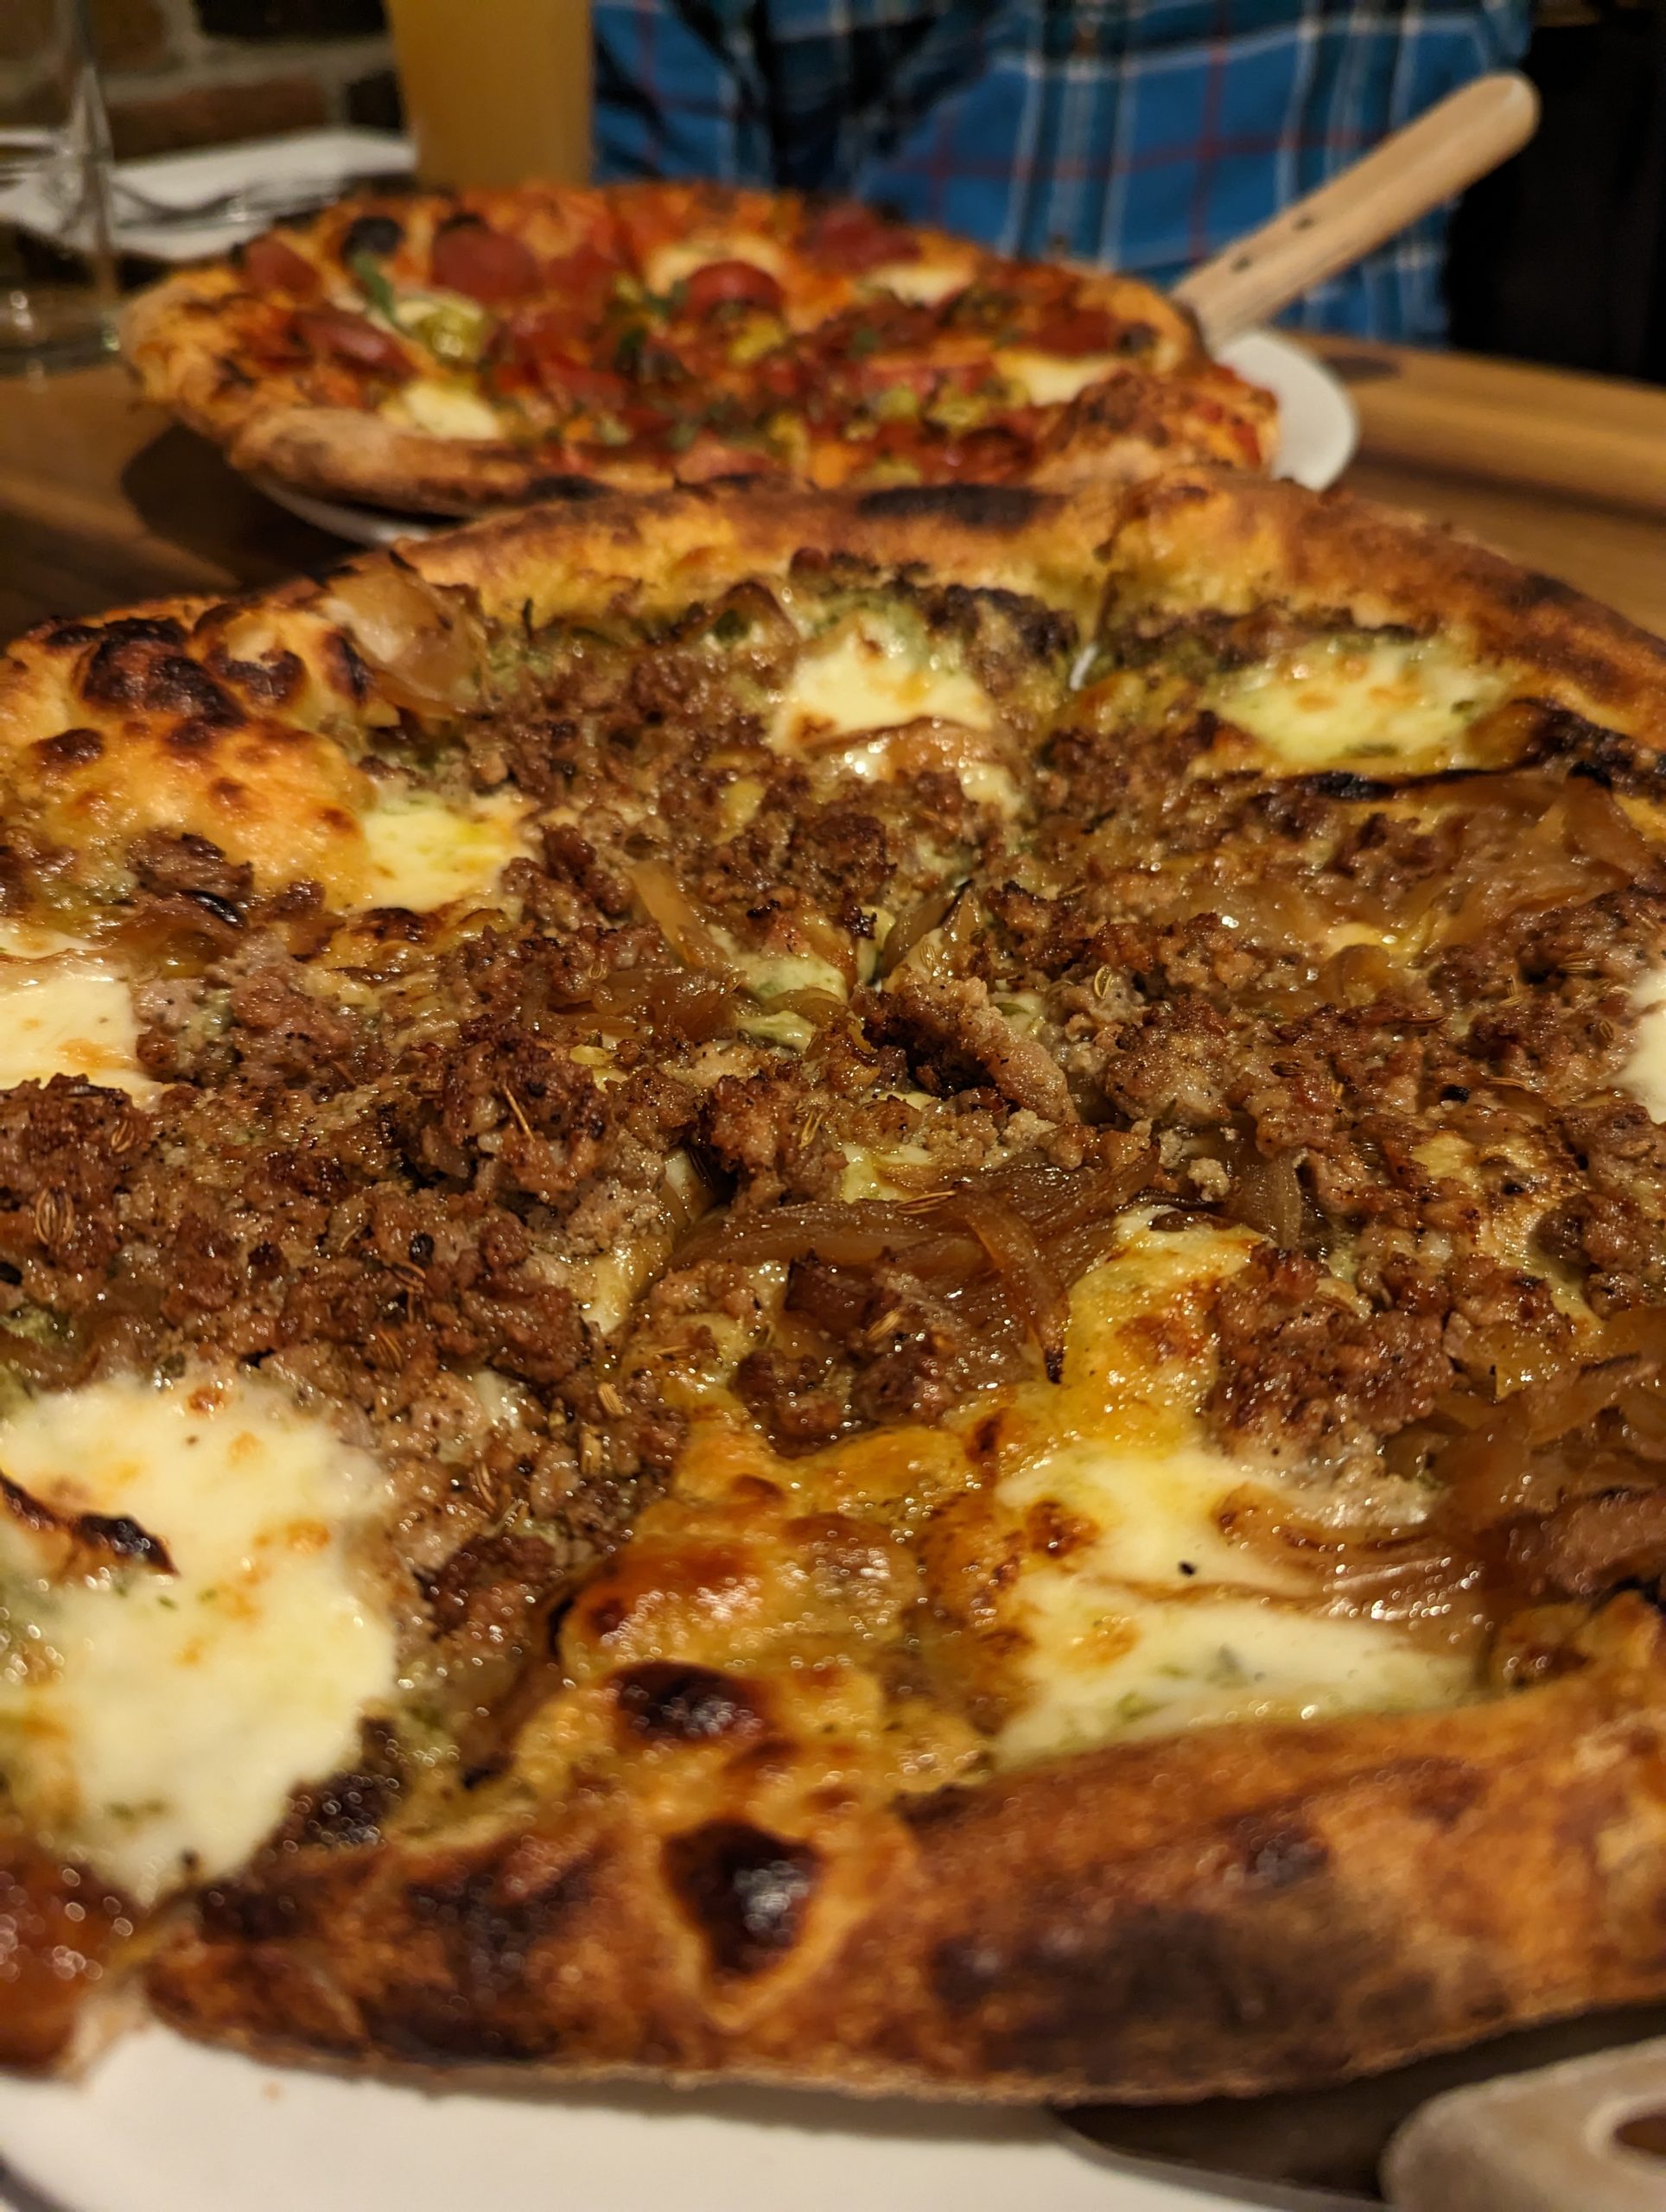
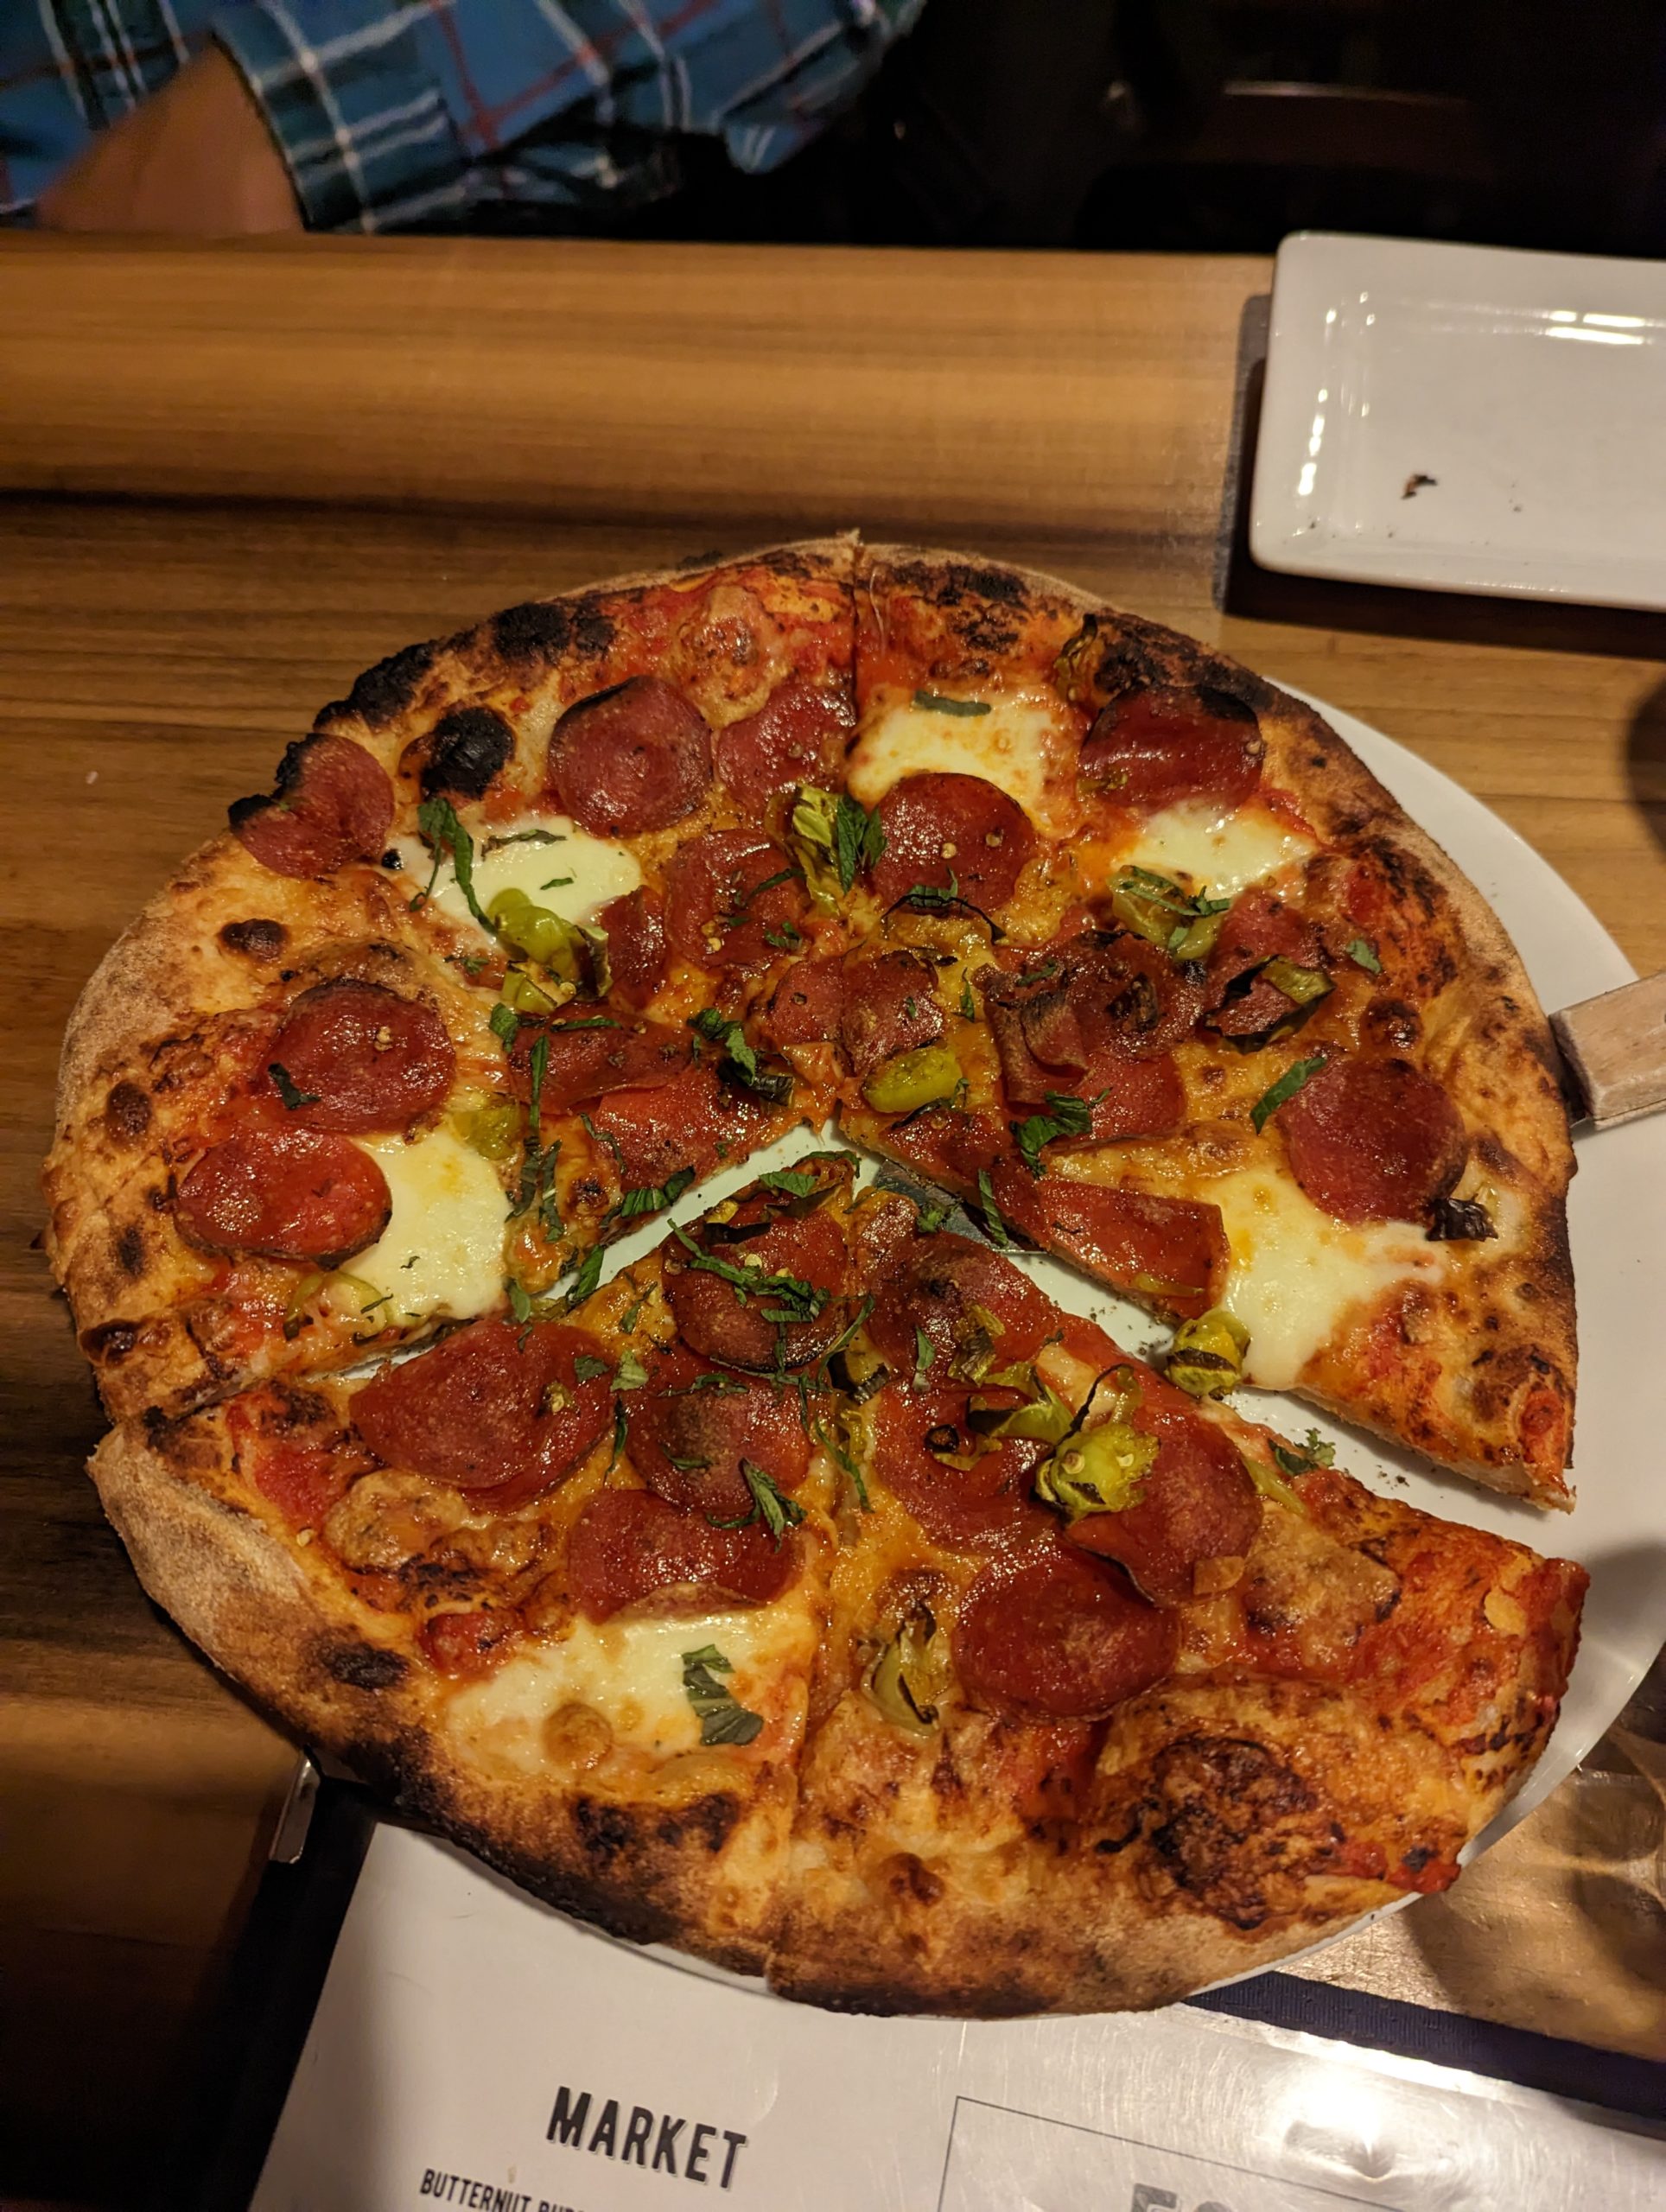
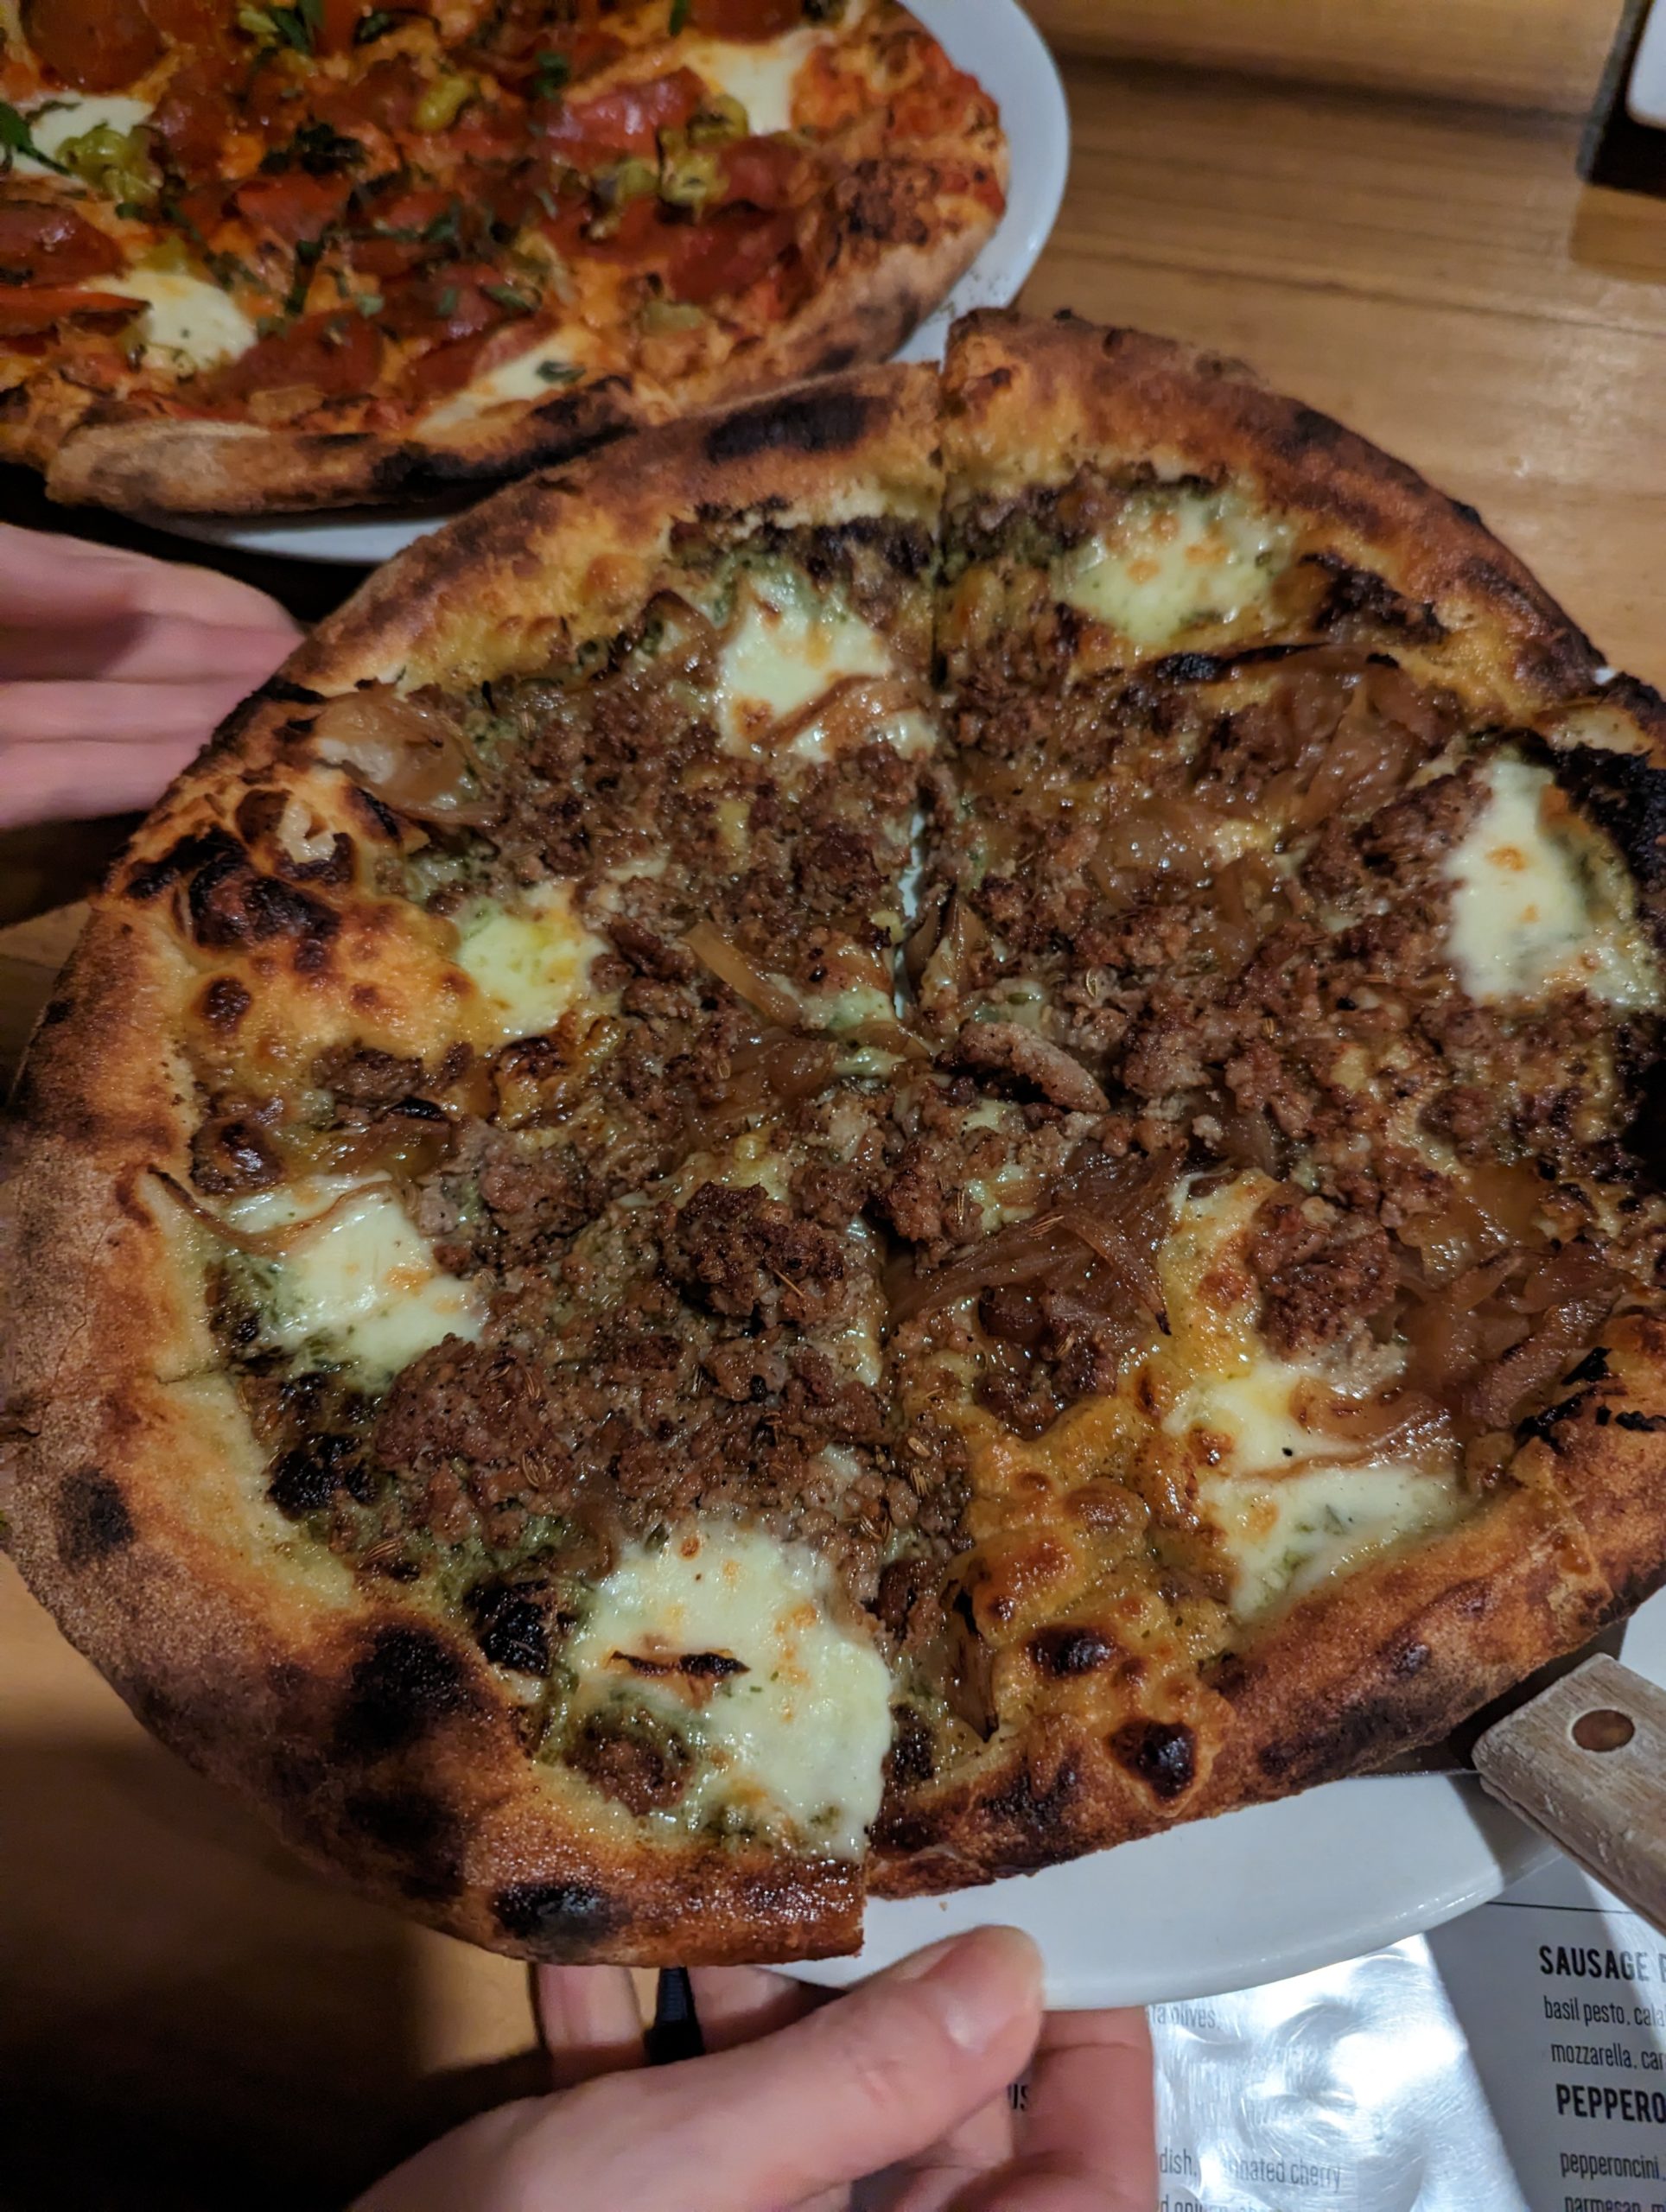
∙ Pepperoni & Pepperoncini (pepperoncini, pepperoni, marina, mozzarella, parmesan, mint), Sausage Party (basil pesto, Calabrian chili oil, crumbled Italian sausage, mozzarella, caramelized onions, parmesan) ∙
Uhh…sausage party? Hilarious flick, serious pizza. The combination of caramelized onions with freshly cooked sausage is incredible. Is it the addition of chili oil on a delicious pesto base? Yes. This is the pie you visit a restaurant for.
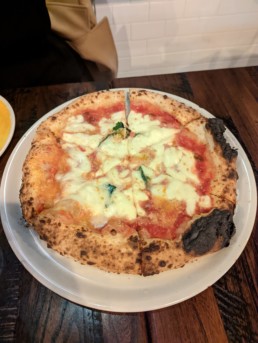
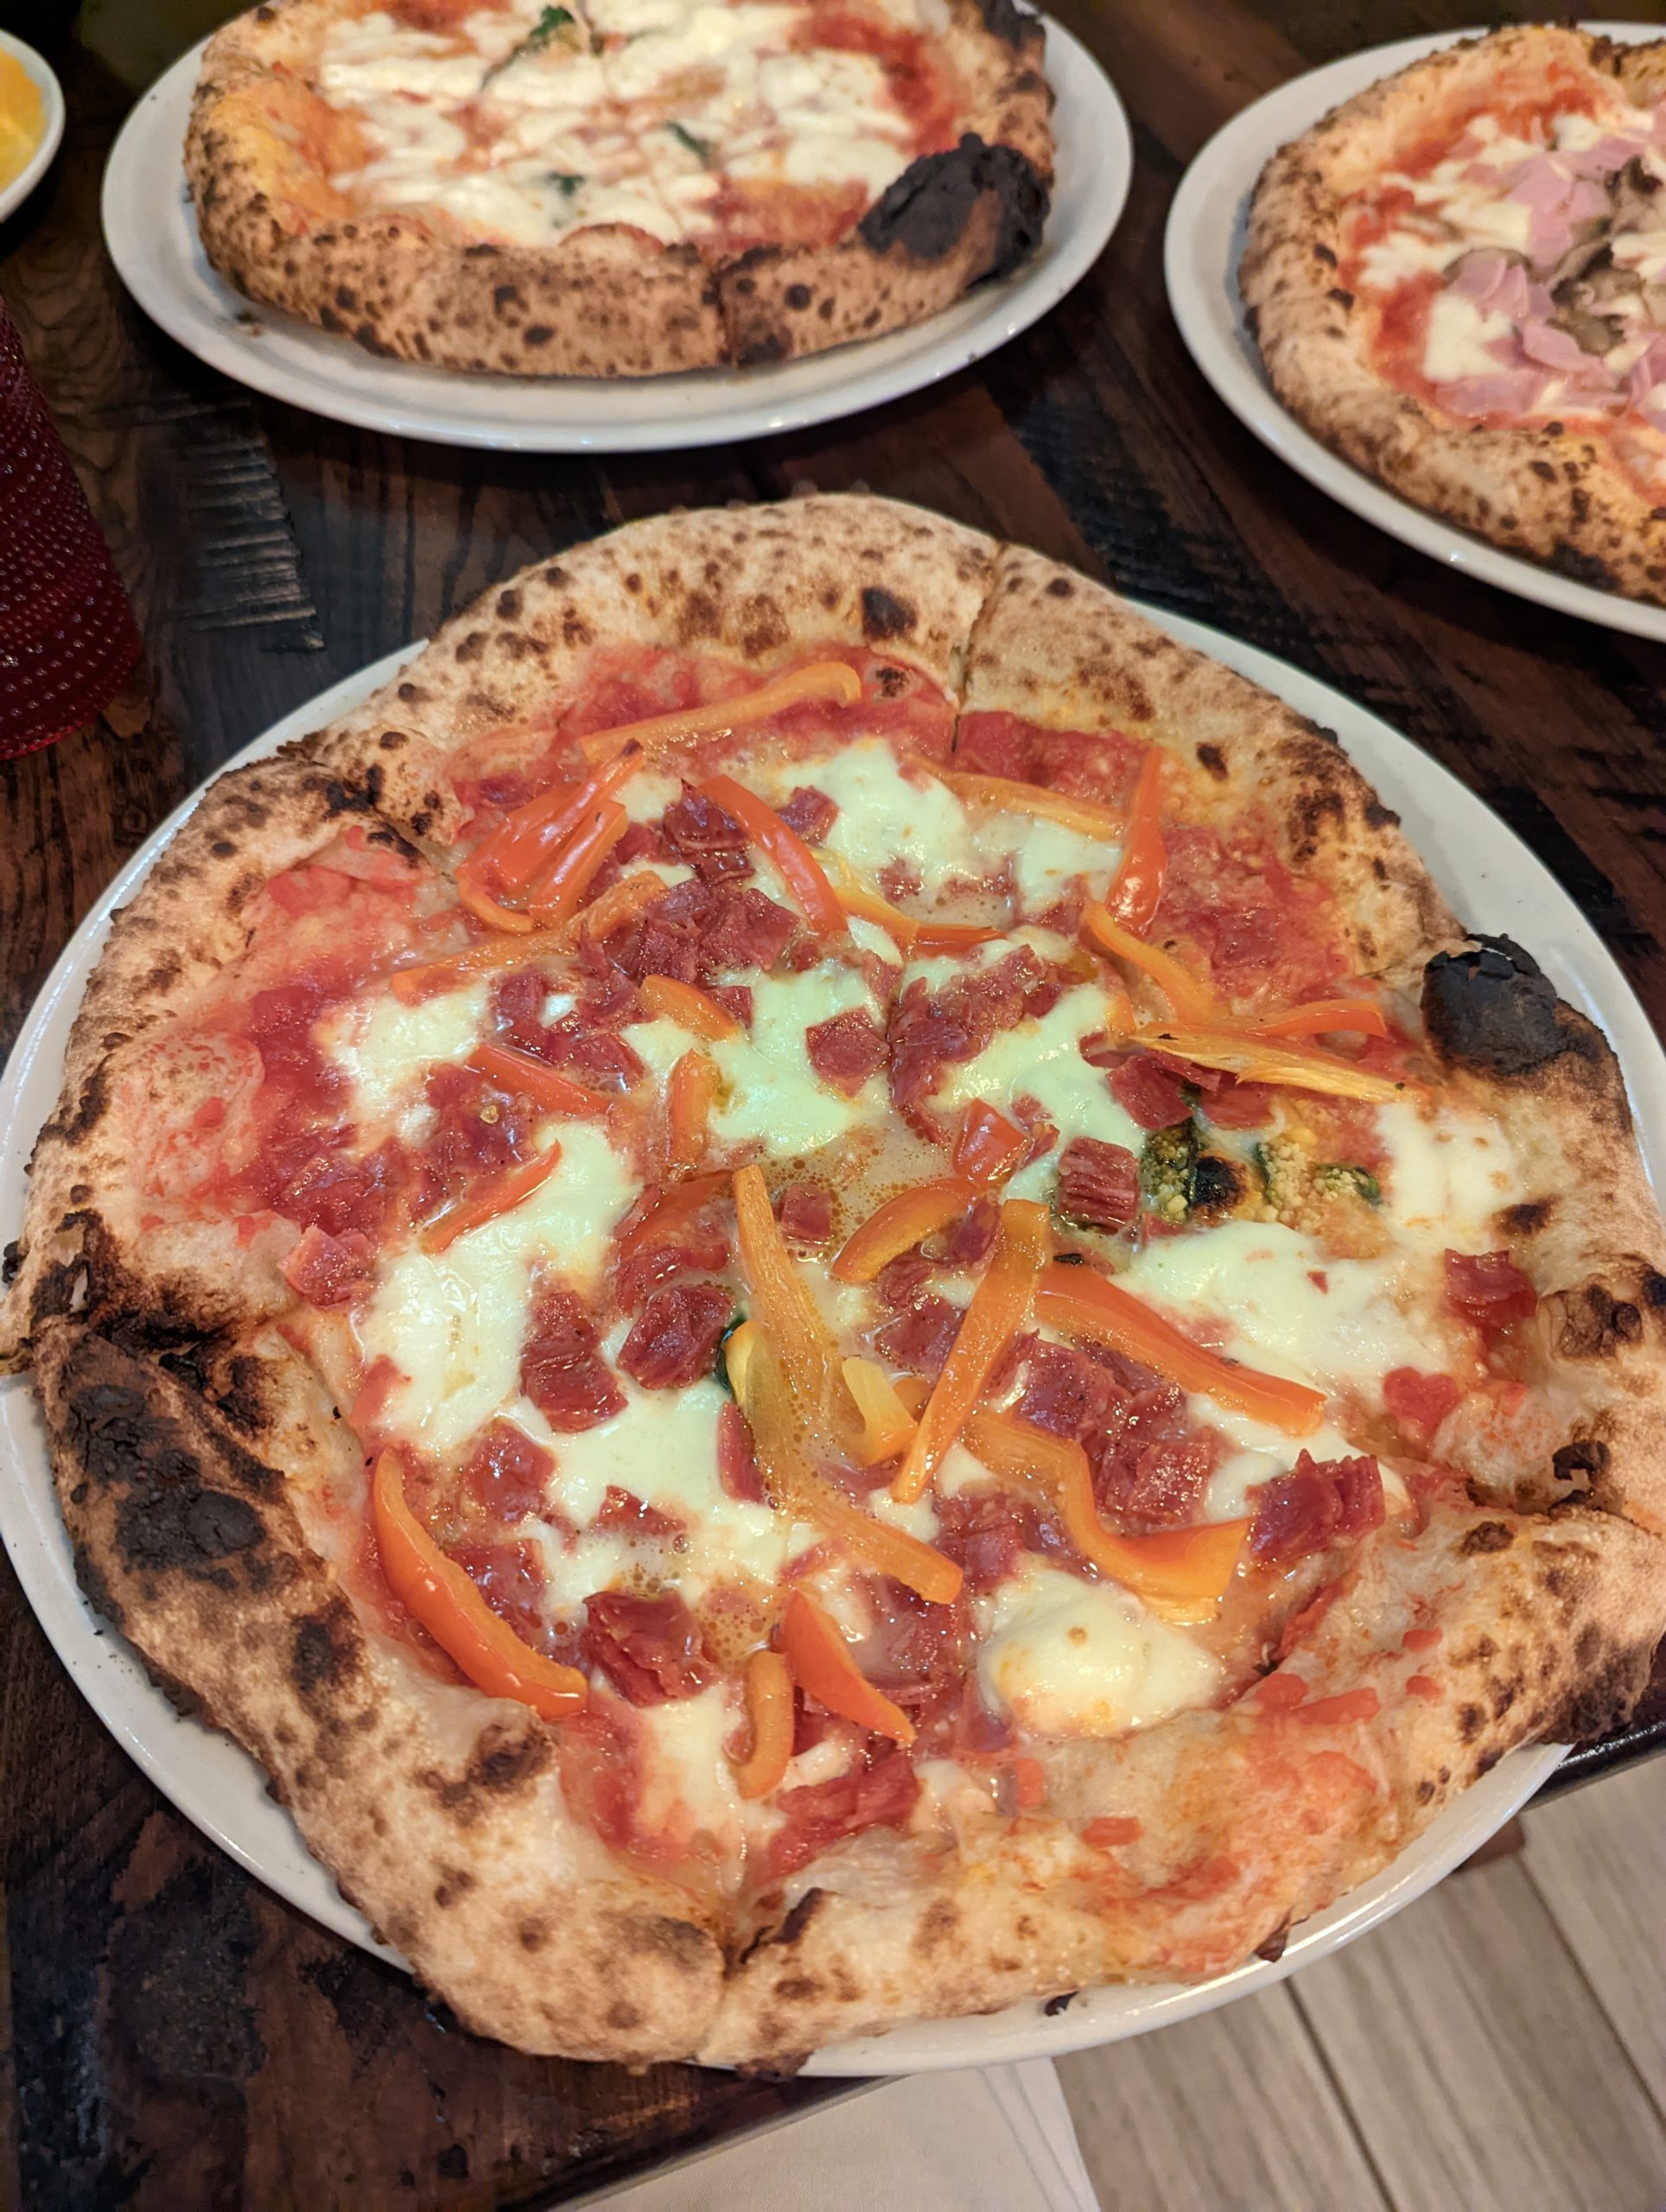
Menomale (Washington, DC)
∙ Margherita, Diavola (DOP San Marzano tomatoes, Fior di latte mozzarella, basil, spicy salami, red peppers), Prosciutto Cotto (Prosciutto cotto (ham), mushrooms, DOP San Marzano tomatoes, basil, Fior di latte mozzarella, pinch of parmesan, EVOO) ∙
♫ When the moon hits your eye
Like a big pizza pie, that’s amore ♫
Let’s start with the delightful Falanghina Beneventana requested by the most soothing & sultry authentic accent you’ve ever heard. Words elegantly delivered by the finest native Italian pizza tour guide you can imagine. When the world starts to shine, it’s not too much wine, it’s amore. I’d like to order this forever, please.
I’m immediately reminded of Pupatella, which would make sense as both restaurants are AVPN (Associazione Verace Pizza Napoletana) certified. My novice intuition tells me it’s undercooked, but the bottom of the crust is beautifully leopard printed. Yes, the marg got the job done. Fior di latte moz was deliciously fresh and the San Marzano sauce was delicate. The margherita was the first pie gone, if that’s even a question. Of course, the diavola spicy salami impressed. By all means, I will be returning with the same beautiful arm-candy to grace American pizza shops.


Result
Result • October 2
This post is a follow-up to “Education,” where we built an AAPL daily chart and explained concepts referred to here.

Here is the August 27 AAPL chart built with EMAs, Fibonaccis, & Volume Profile. I thought it would be helpful to review the results and see how the tools work.

The annotated chart above from six trading days later on September 6.
EMA Crossover – the bearish signal of the shorter EMA crossing under the longer EMA turns the cloud red. The trend flip occurs many days after the recent peak because EMAs are lagging indicators.
Fibonacci ‘Tests’ – note the candle interactions with Fibonacci levels, and look for confirmation of the level holding. Note the .38 tests & fail, as well as the .50 test.
Volume Pivot – The large volume shelf on the profile (static from Aug 27) serves as a pivot from support to resistance on the last candle. In the top chart, the last candle pushed down through a volume node on significant volume. The target would’ve been the next volume node below it. You don’t need to wait for an indicator to point out that idea when using VPA.
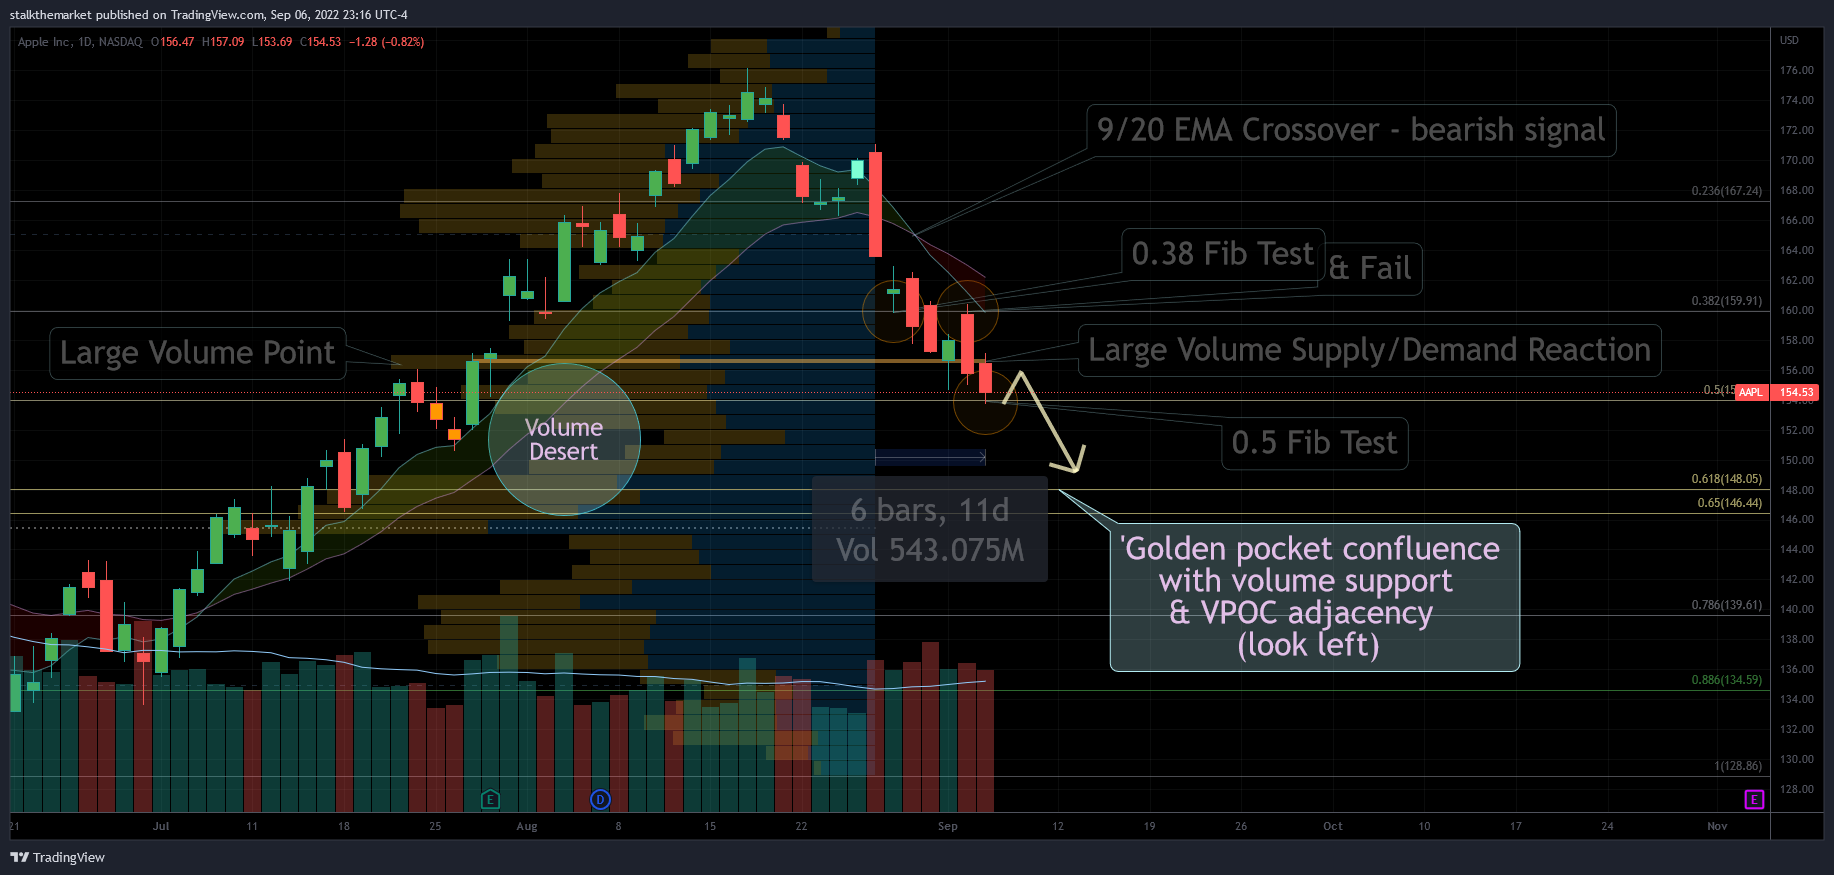
These tools identified the target. My eyes were immediately drawn to the golden zone (.618-.65 fibs), a key retracement area for fibonacci traders. The ‘volume desert’ (low volume region on profile) above the zone was another useful signal. That volume gap was also supported by the VPOC (highest volume in the histogram). The areas together – VPOC & golden pocket – showed confluence, strengthening conviction in the technical target.

Disclaimer: I’m not short AAPL (prefer SPX puts). I wasn’t, nor will I ever recommend you do anything with your money.
These tools informed a bearish thesis on AAPL with a target of the golden pocket & VPOC. A bounce out of that region on strong volume would have been a near-term bullish signal. A failure of that region confirms the bearish thesis and warrants a lower target. Every signal needs to be confirmed with follow through. One candle does not suffice.
The above Sept 30 chart reviews the Sept 6 target, 24 trading days after the original chart. Note that the EMA trend was broken only once, and the next daily candle respected the line perfectly. The EMAs were tested and held again a few days later. The golden pocket & volume point of control served as near (not exact) support for the stock on the hammer candle followed by a bullish engulfing candle. The 3rd from last candle bounced on high volume in that region. The following candle failed that region at open, and the price has been plummeting since.
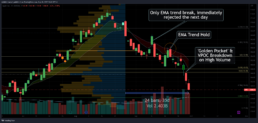
(slide picture left to right)
Hopefully I’ve understandably displayed these tools and clearly explained my interpretation of their movements. I find these tools useful, and think everyone should find tools which work for them.