
Education
Education • August 27
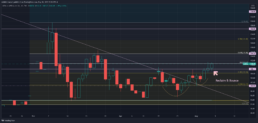
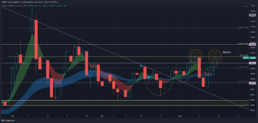
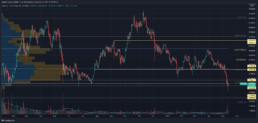
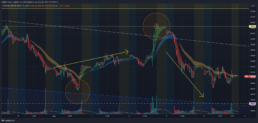
Building an AAPL daily chart
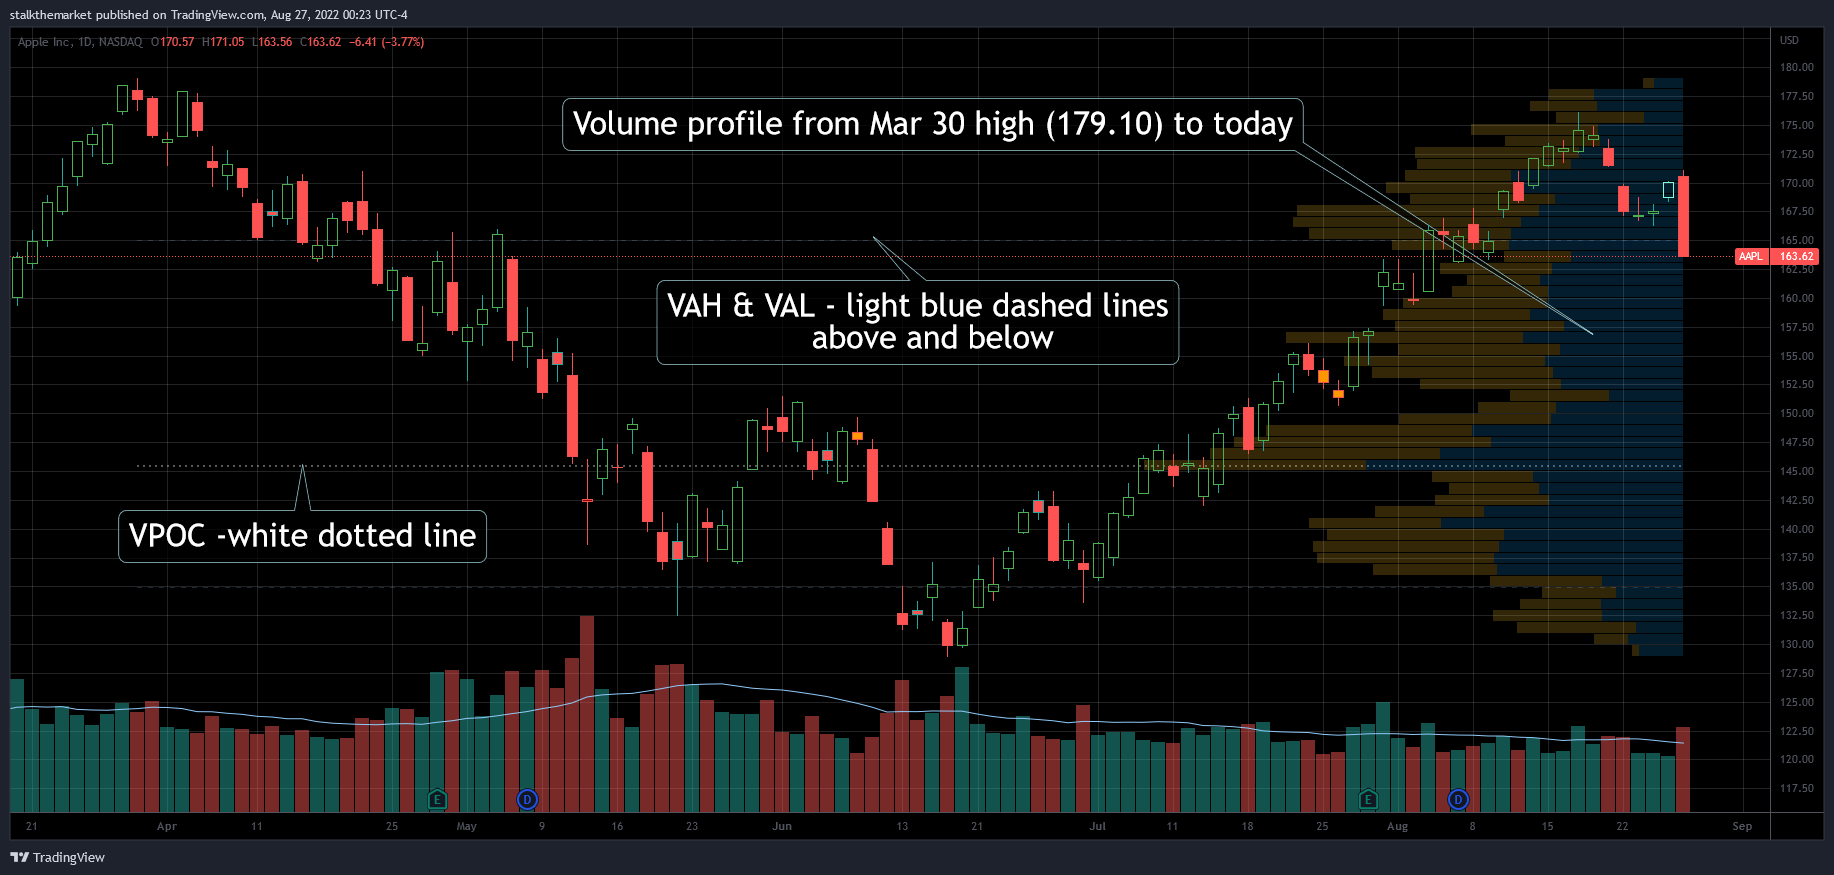
- Volume Point of Control (VPOC) – highest volume bar in the histogram
- Value Area – 70% of the volume within the histogram, bracketed by the:
- Value Area High (VAH) & Value Area Low (VAL)
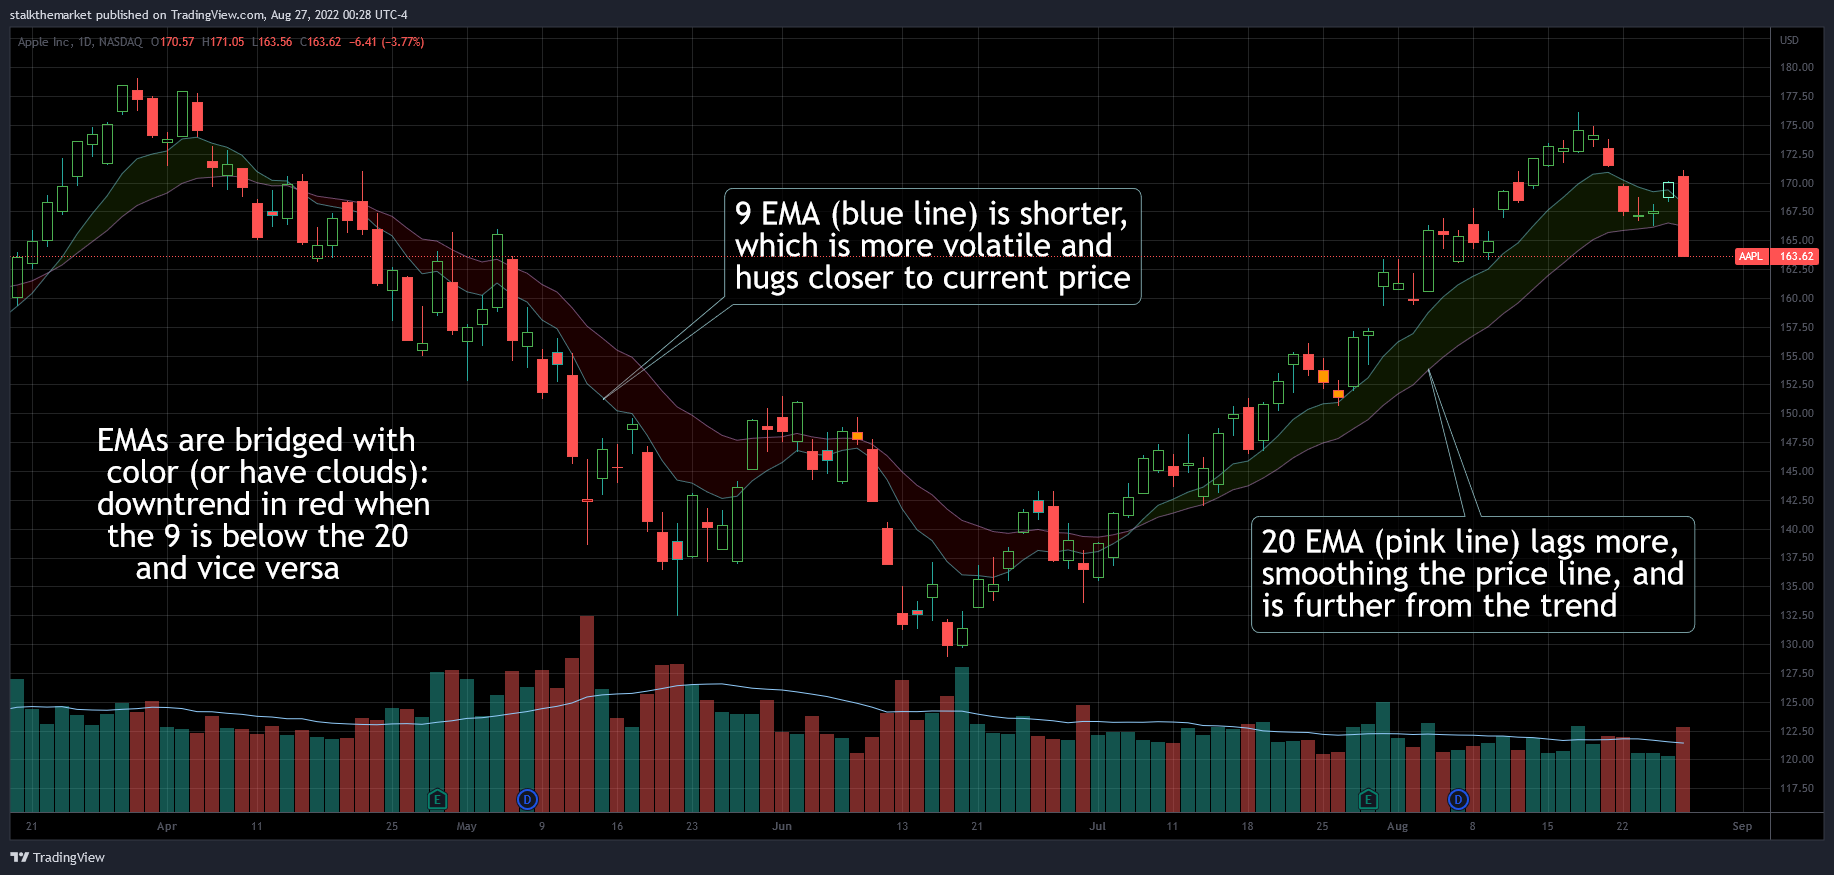
- Simple (SMA) – average price of timeframe specified
- Exponential (EMA) – a higher weight of recent prices calculating the average
One could argue both, either, or neither SMA/EMA levels are valid. The 200 day SMA (mean of the last 200 days) is a highly psychological long term trend commonly discussed in financial press. My favorite EMAs are the 9 & 20. I like shading between the EMA spread, creating clouds – a visual tool that slaps you in the face with a trend.
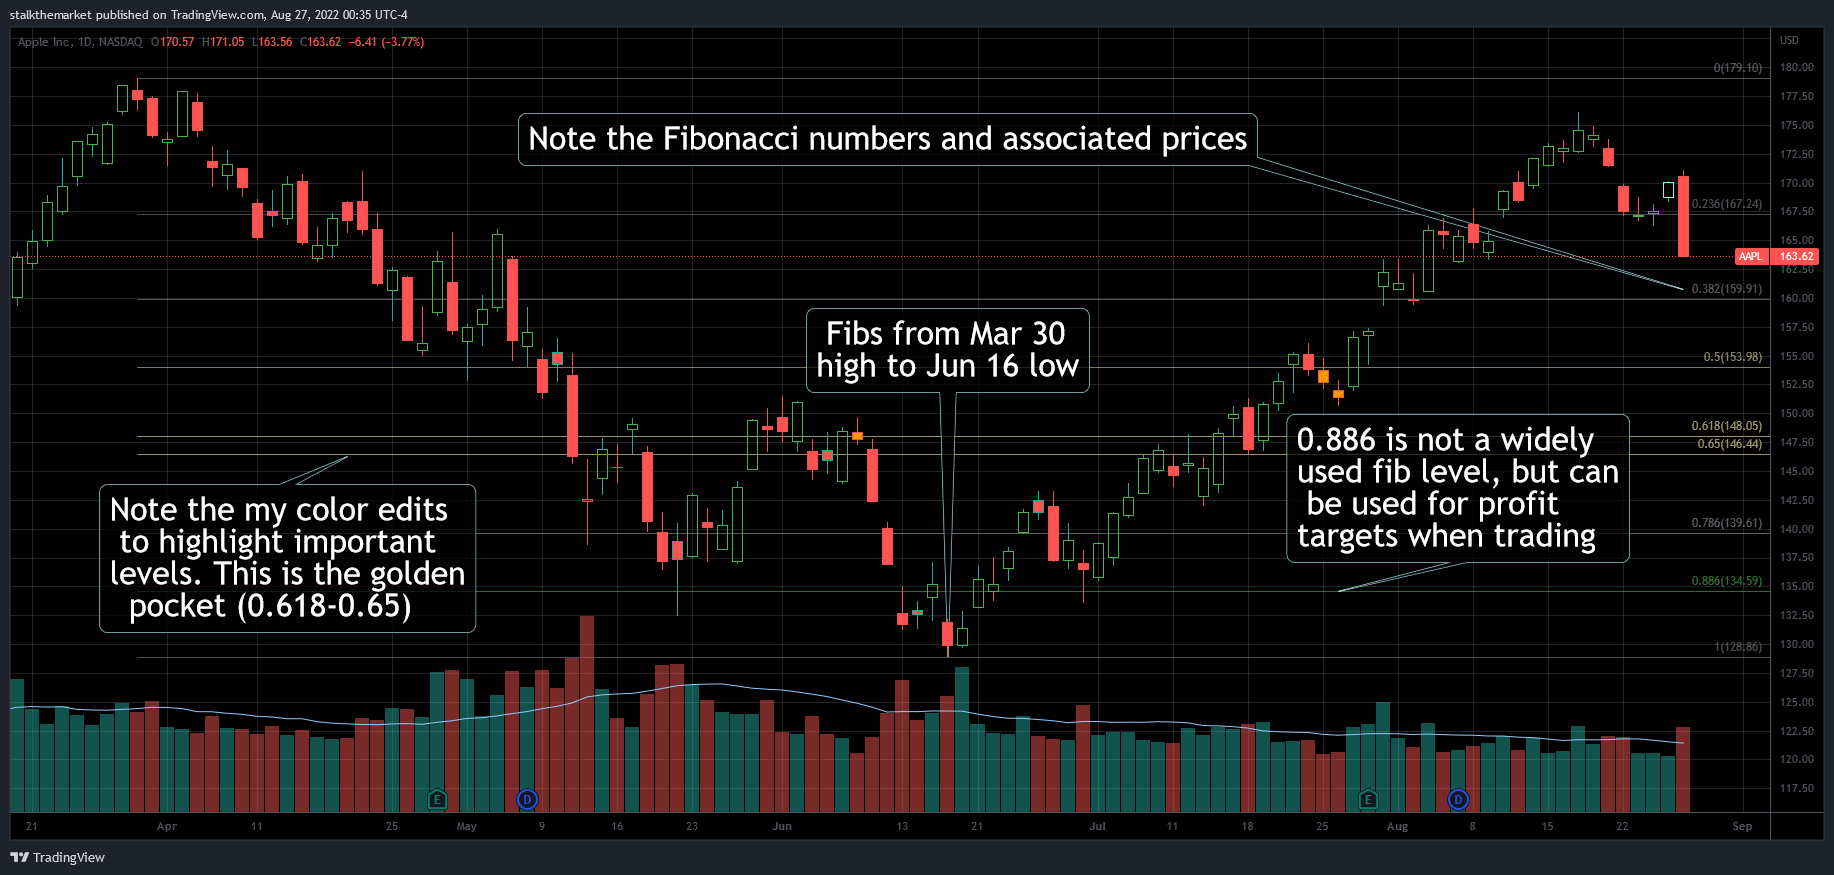
Fibonaccis are a set of ratios based on the numerical sequence. Named after the Italian mathematician who brought the ancient Indian study home, fibs [as they’re called] are an incredible tool. I plan to opine on the subject in another post.

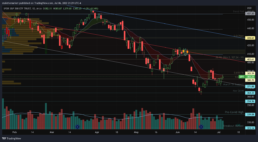
(slide picture left to right)
Putting it all together looks kind of busy, right? Or does it add context? Using only a few tools helps to filter out the noise. That’s why I like to have my annotation color settings in higher transparency. Otherwise, it’s best to just do it naked. Always good advice.
Summer
Summer • July 6
Most summers are boring and have very low liquidity. Not much point to opine on trends when there’s no volume showing money put to work. Fed minutes (not meeting) were released today, yet volume was lower than yesterday. Not much to note, but still cool to see the chart interact with those levels.
Well…maybe we could mention oil getting absolutely smoked on recession fears as yields blow off and the dollar continues to rip. Sure there are things to discuss…but everyone is at the Hamptons.
Distribution
Distribution • June 13
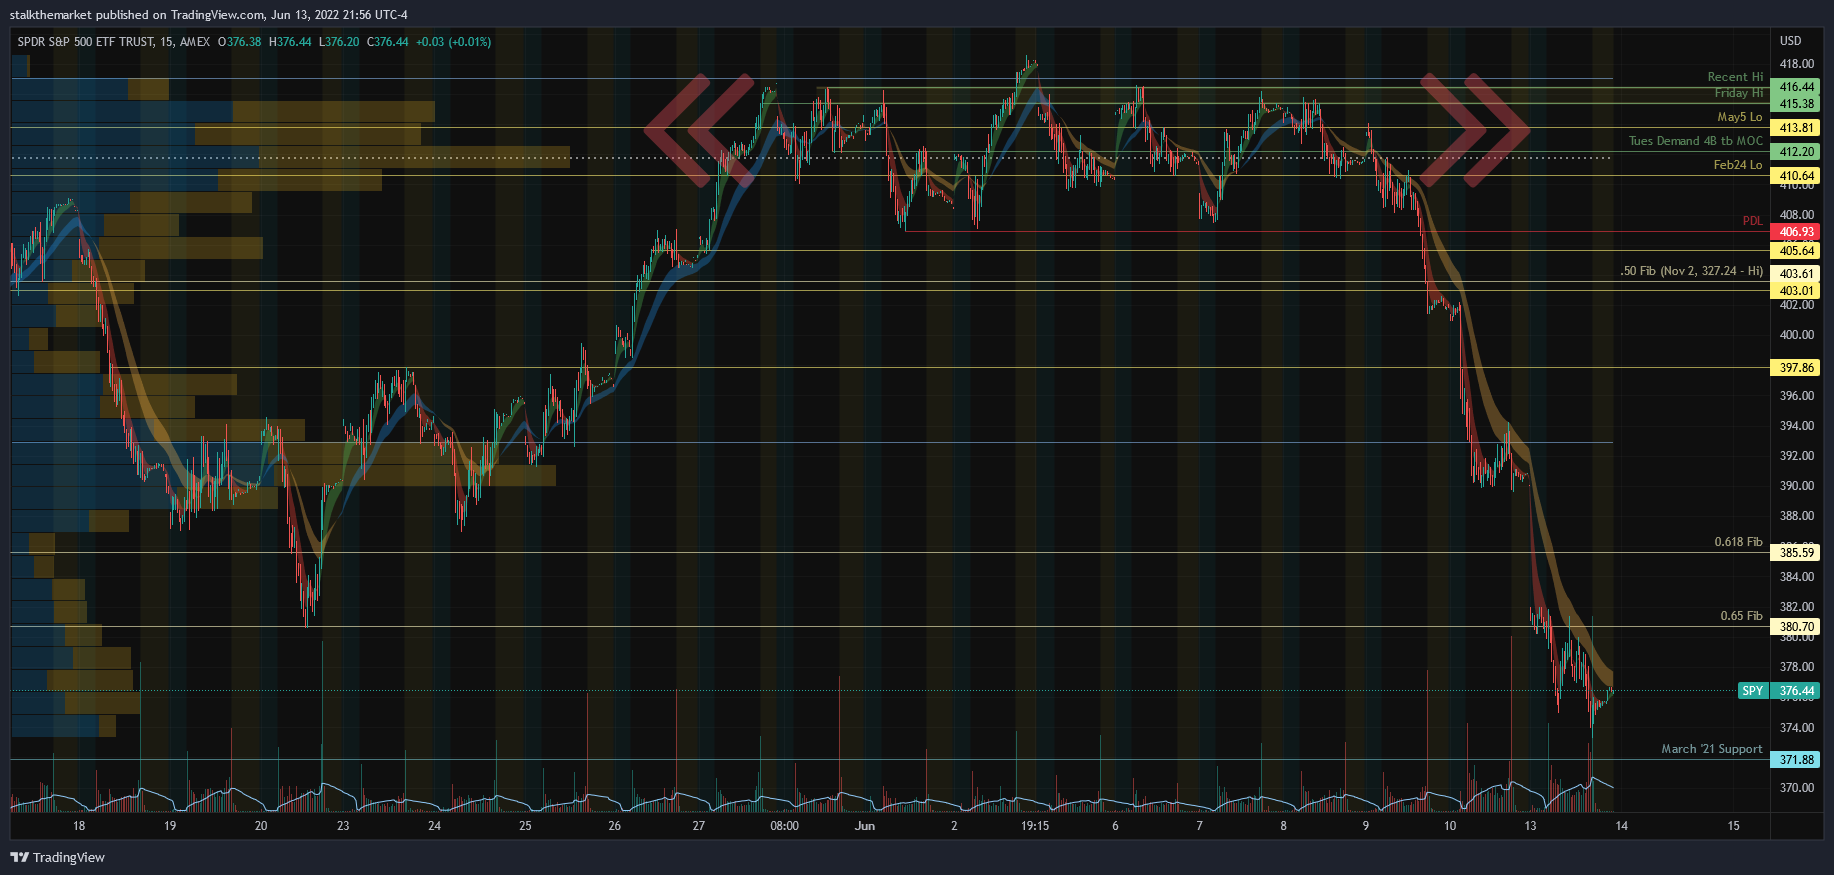
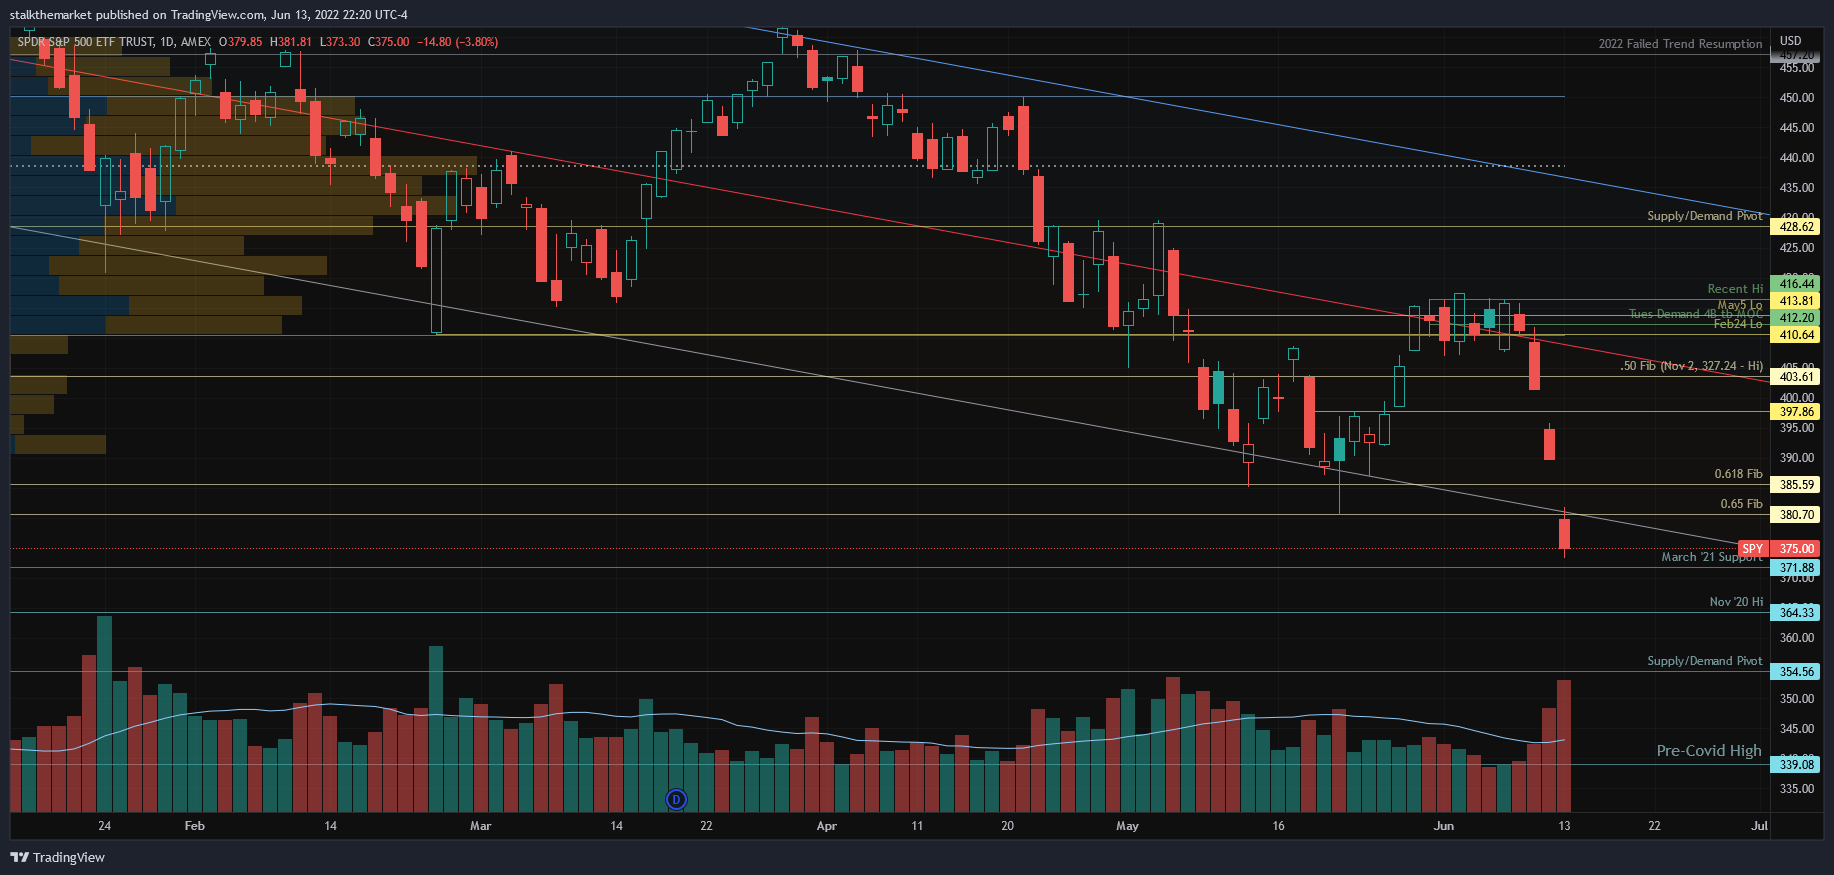
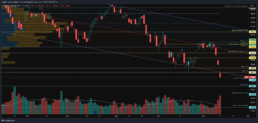
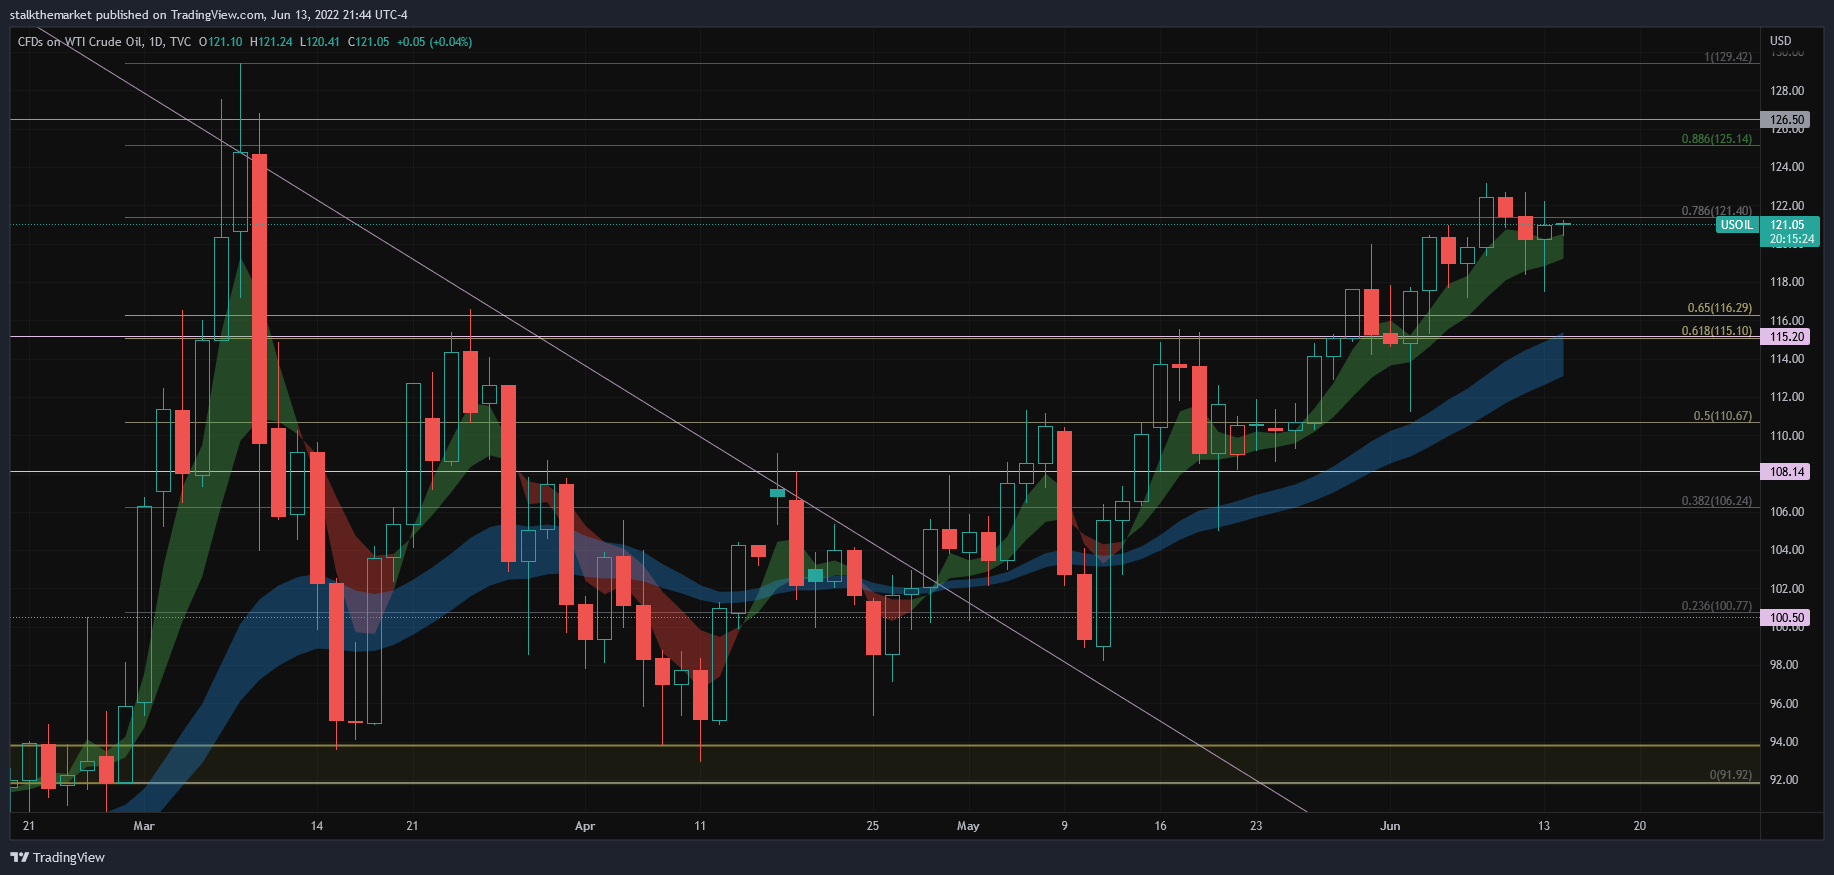
Well that was a terrible time to adjust the regression channel. Today the market got smoked as the 10 yr moved to 3.35, while both the golden pocket fibs and regression channel acted as resistance. Your next levels lower are large volume days and support areas. We’ll see what the Fed does Wednesday. Who knows if Powell has the stones for a 75bp hike…a guy can dream.
Oil
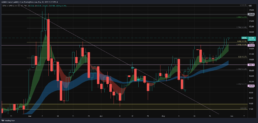
Although the equities look rough, the commodity remains strong.
Bitcoin
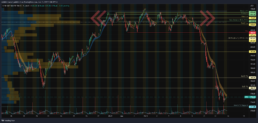
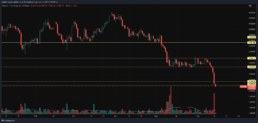
Crypto is absolutely falling apart. The large US corporations, El Salvador, and most retail wallets are underwater on their BTC investments. The rest of the crypto complex also looks like death. I’ll start adding to ETH after it breaks 1000.
Learning
Learning • May 30
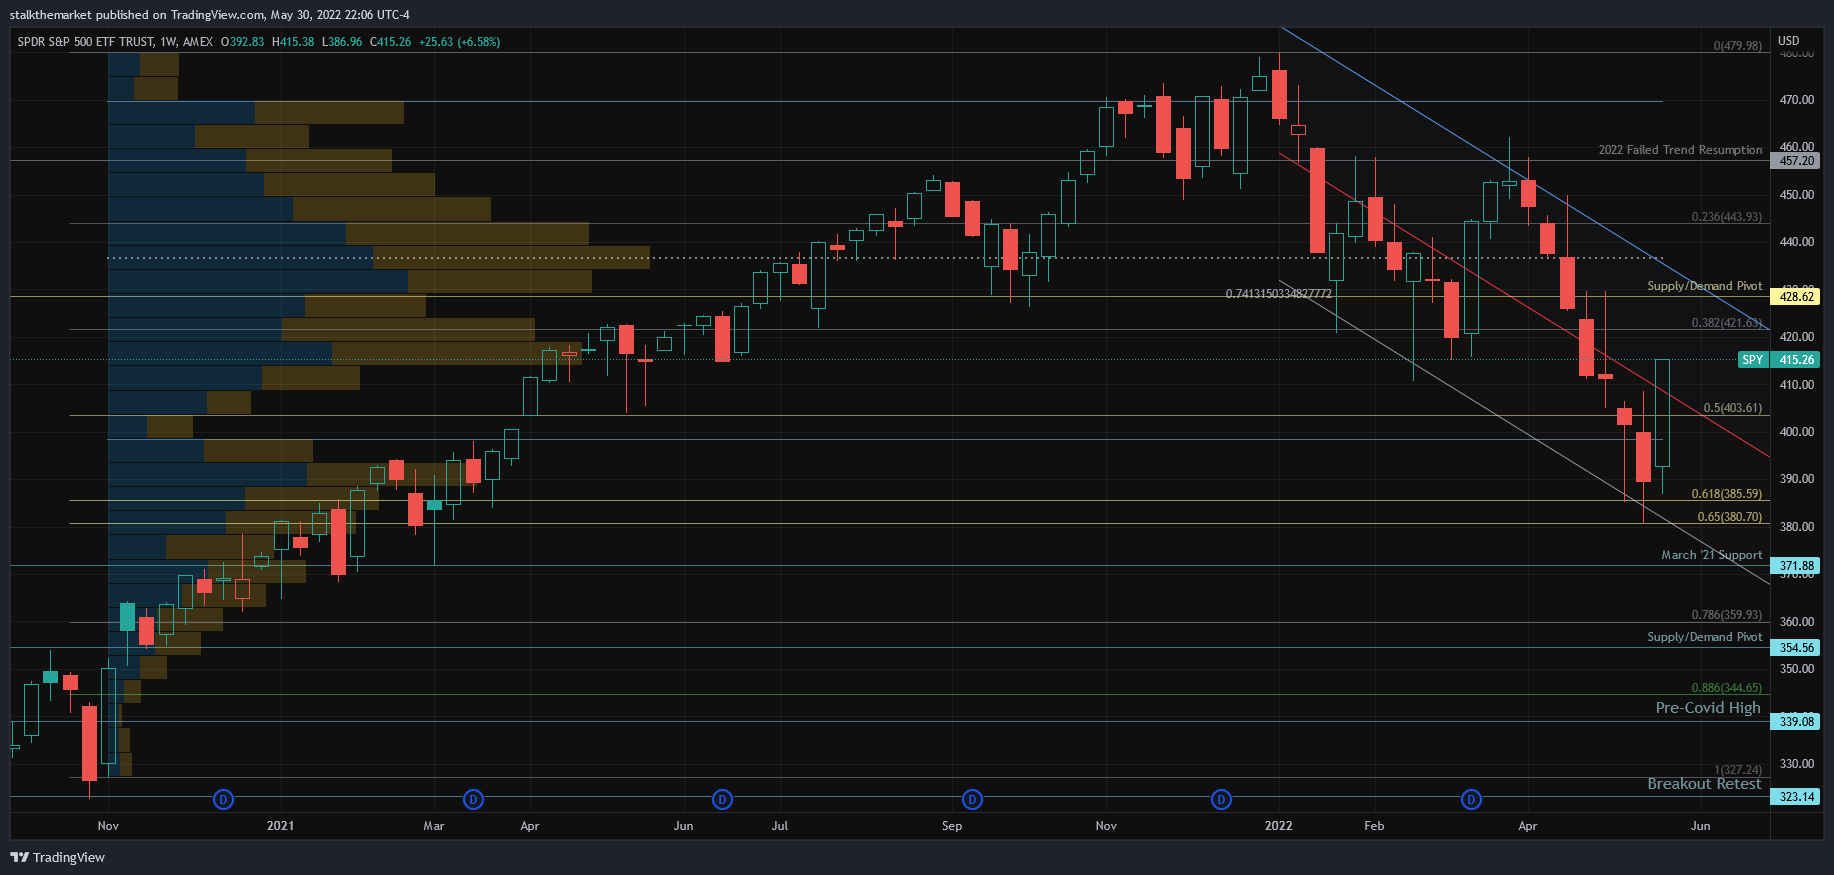
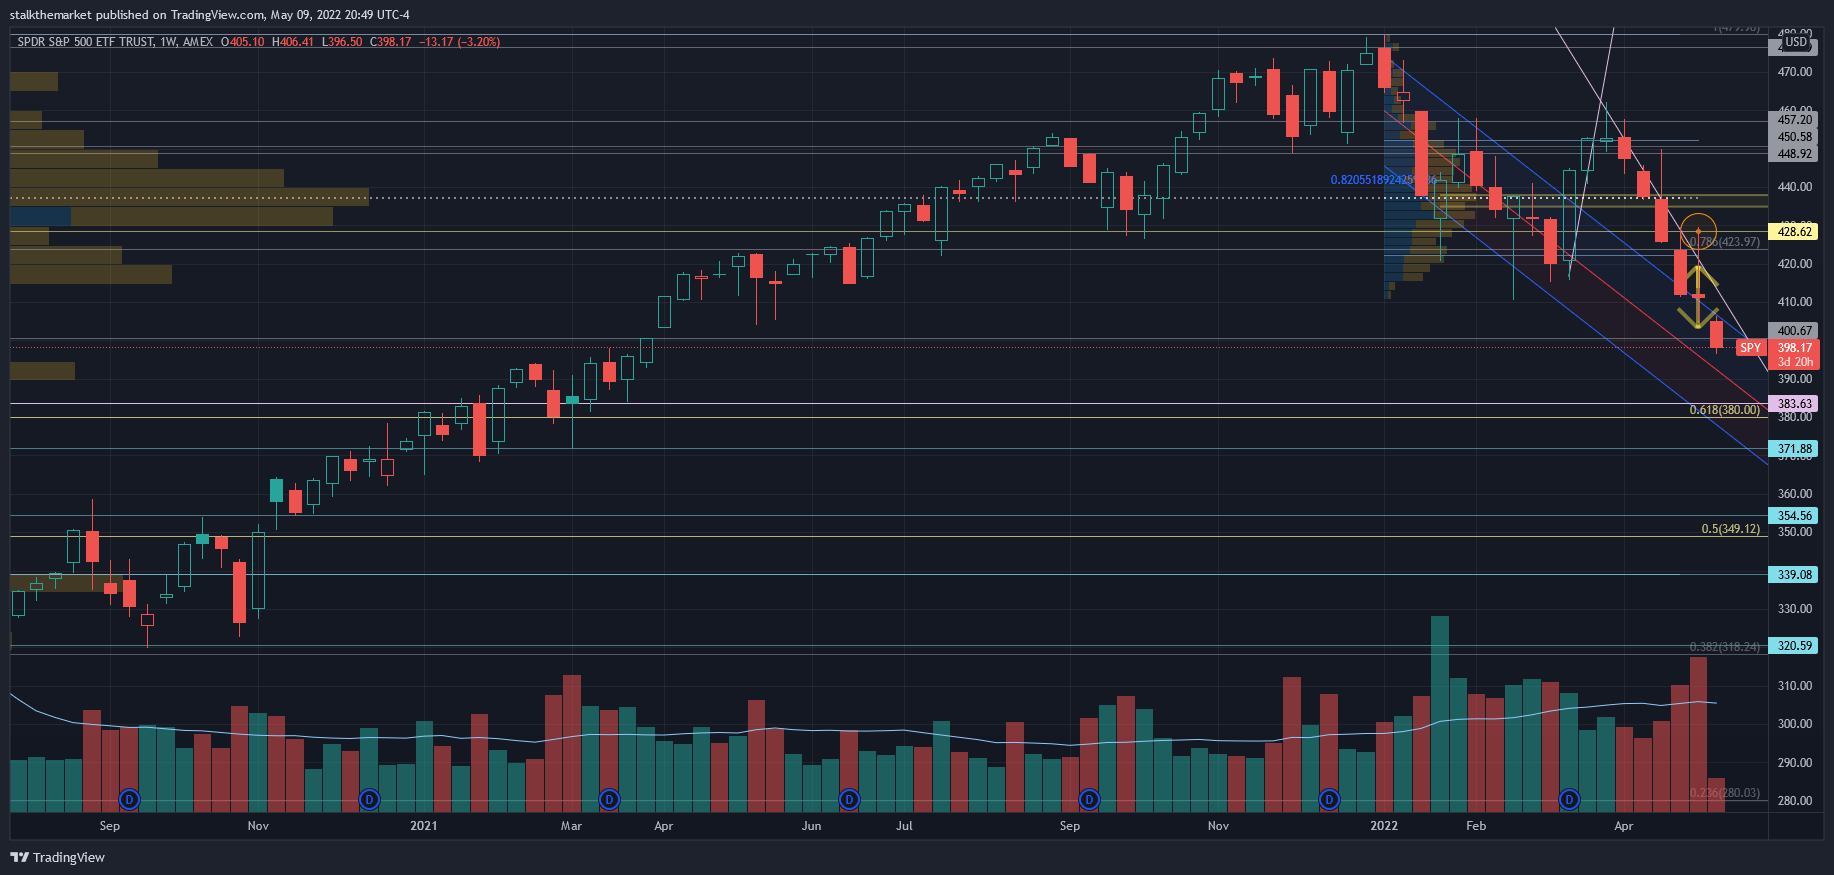
This is a weekly chart going back to the October 2020 technical breakout of Feb 2020 high consolidation. As mentioned before, the ‘golden pocket’ (0.618-0.65) [is what fibonacci fans believe] provides a good risk-reward area in a trend to enter a trade. Bulls successfully defended this region (380-385) two weeks ago. I think the market can move to SPY 420, although I believe in the defense of the ~428 resistance level. You’re in a pretty clear region at this point: 385-425.
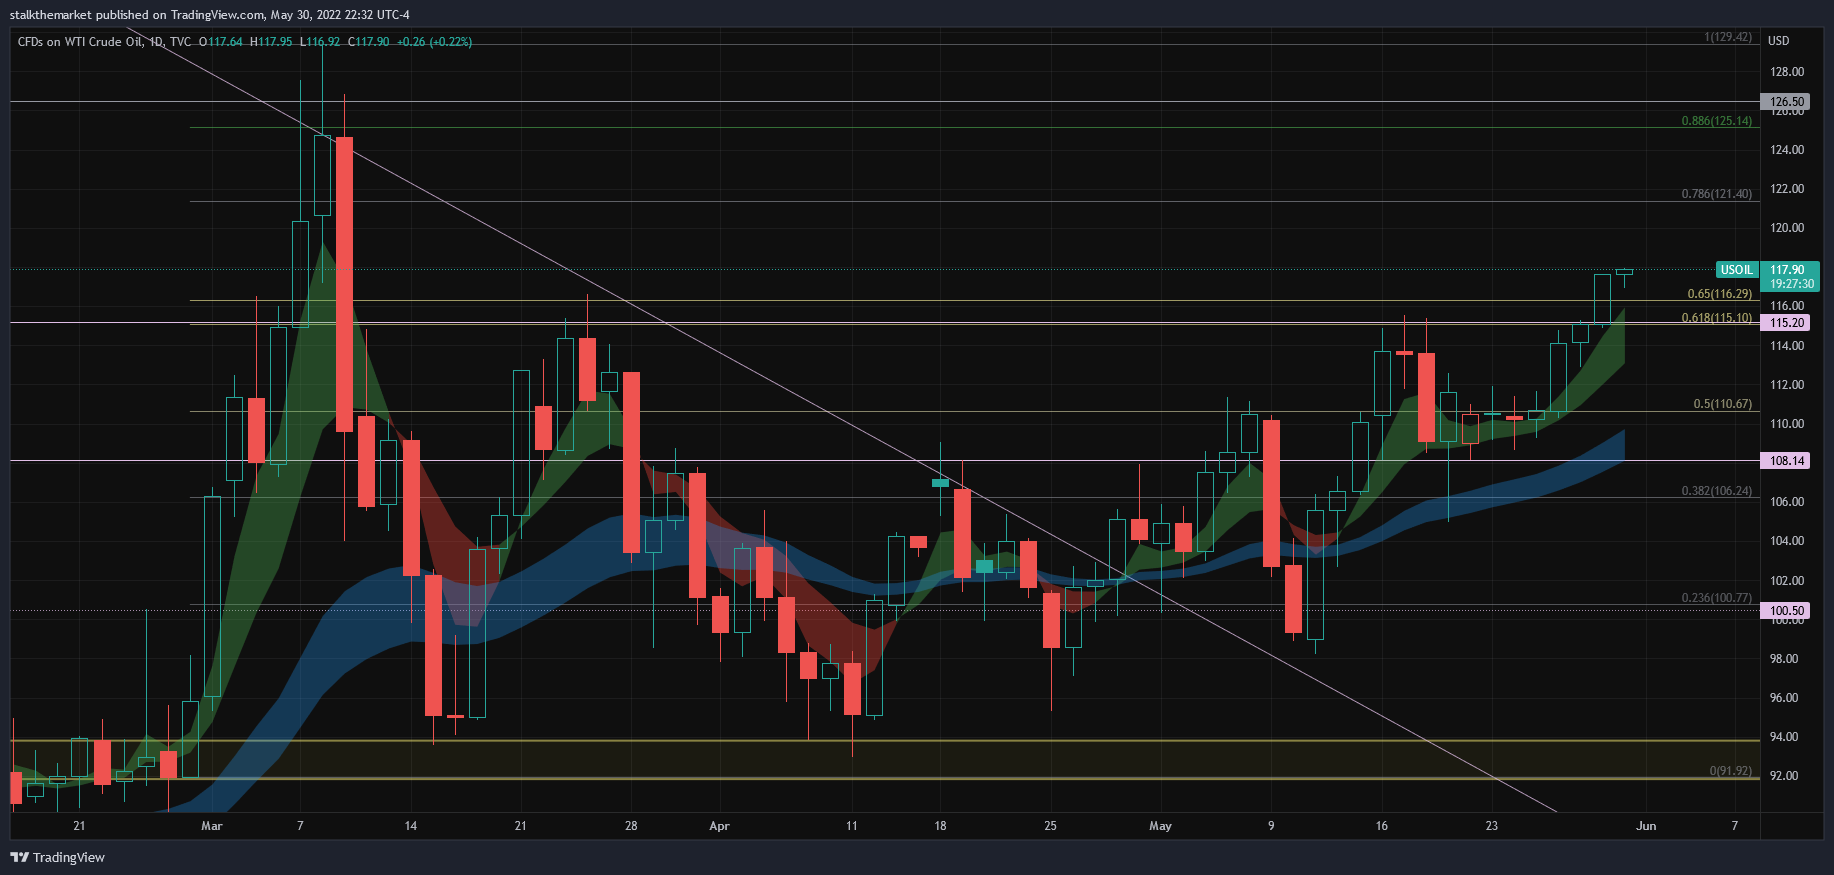
Oil
Aaaand breakout. I’m looking for 125. Remember, surging oil price is negative for hopes in an overall market rebound.

Bitcoin
Does BTC want to break out of this consolidation channel?! It shows hope for overall risk appetite in the market.

Battle
Battle • May 22
Again the arrows, which are just goofy representations of bear flags, prove to play out. On the chart, I am starting to dim the annotations after the moves materialize.
Oof. This week was tough. Positives: we rallied near 380 SPY (the .618 fibonacci level); Negatives: everything else.
A lot of people are looking for capitulation. This is liquidation. There are already firms blowing up, and you can see it in the price action: stair stepping down every 15 minutes.
I’m often discussing with friends this year’s winners: oil & agriculture. Despite the heavy influence from the war in Ukraine, they benefit from high inflation. If you’re in pretty much anything else, you’re getting smoked. Retail company earnings are painting a bleak picture for the consumer. Consumer credit is increasing (more credit cards, less cash). These are not the makings of a strong overall market.
Let the diamond hand memes flow.
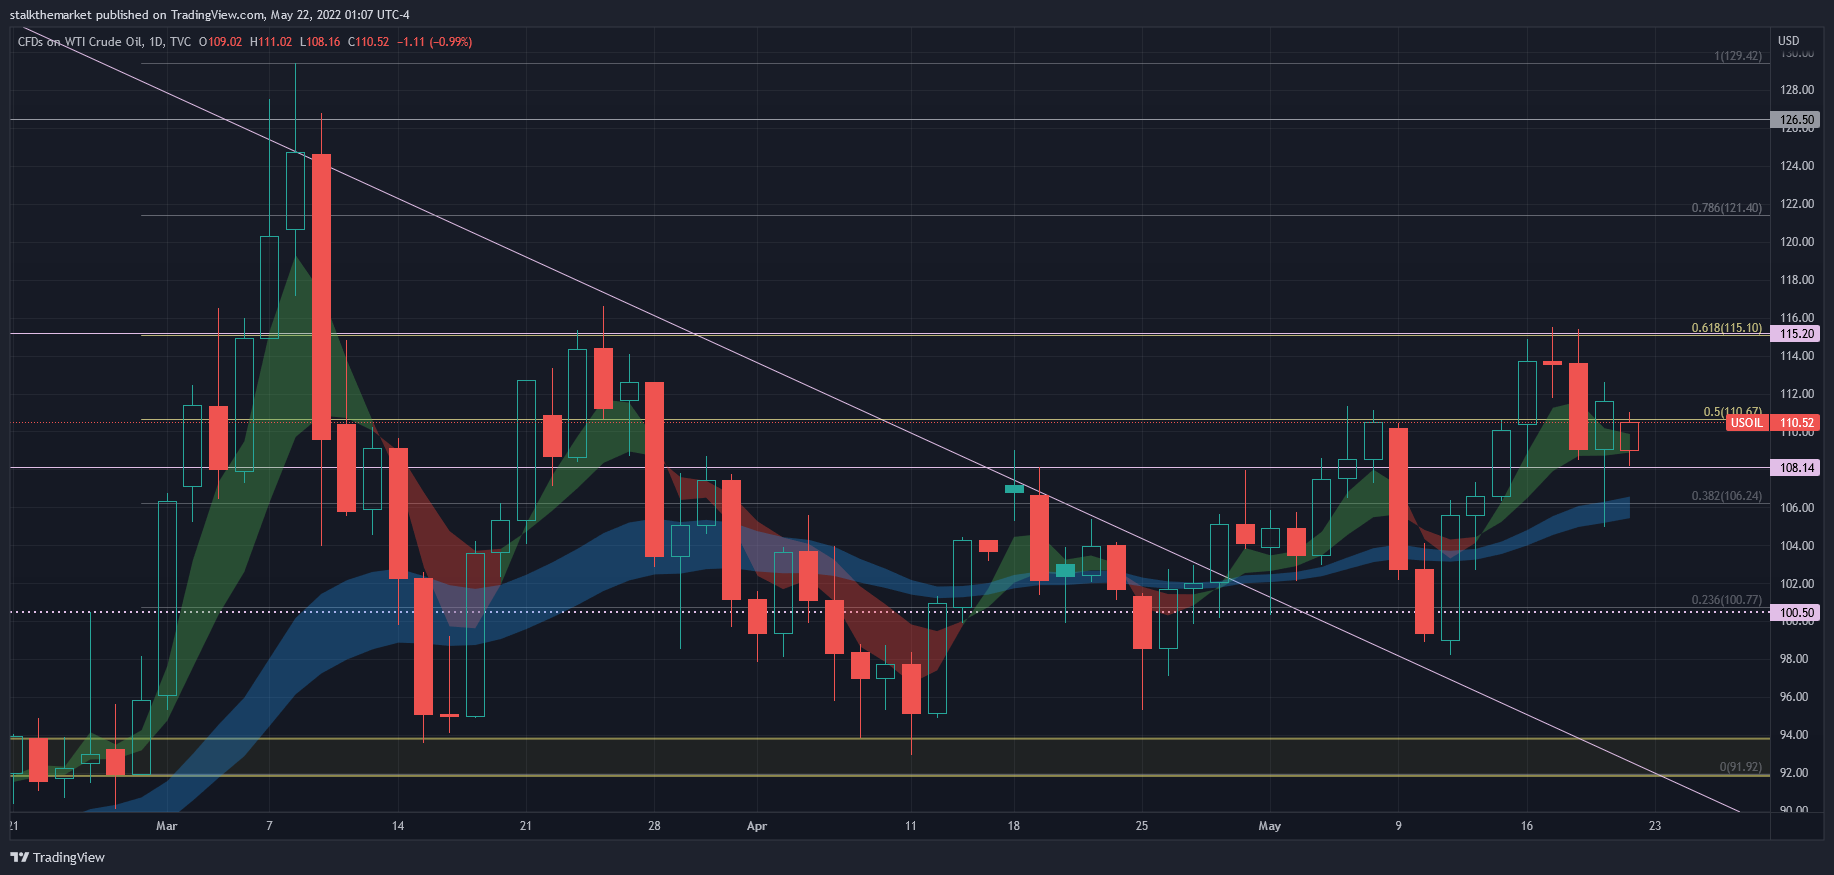
Oil – I won’t continue to state the macro bull case. I think despite some chartists calling for oil to top out, we’re going higher. I’ll eat oil company dips…the market is scary right now, but I’m confident here. It is fun to see the chart interact so well with fibonacci and weekly levels.
All annotations are from past charts unless noted – check out prior posts!
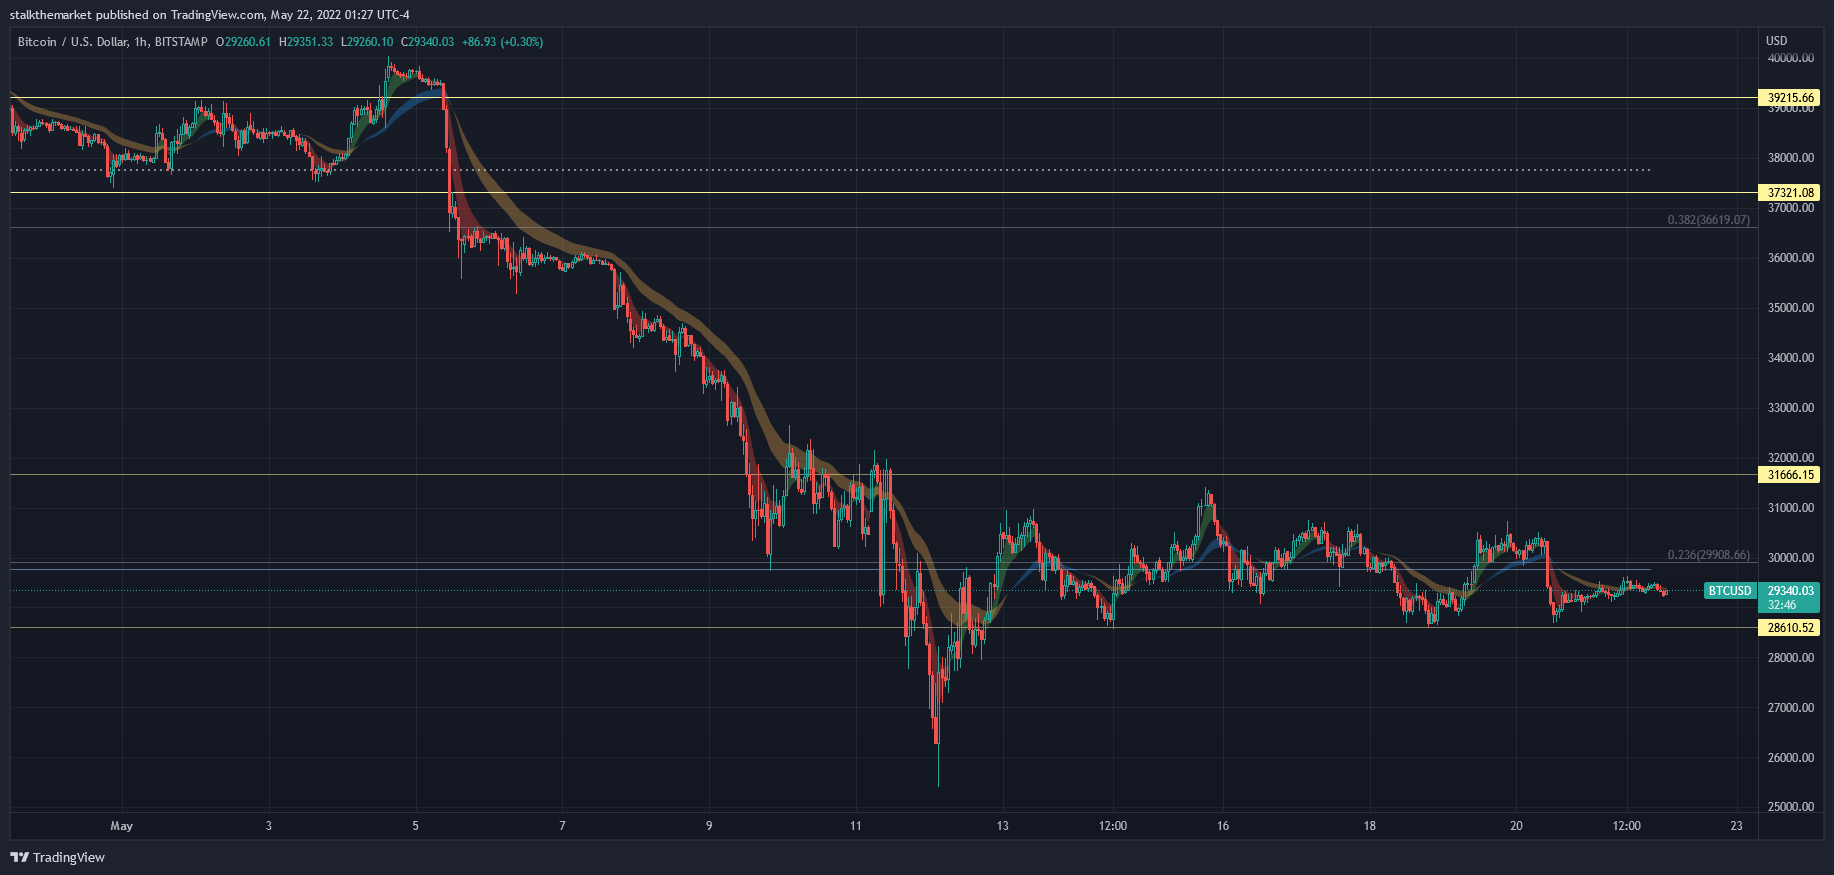
Bitcoin – look how tight it is trading in this range, on a slow downtrend. The chart feels like it wants to break down, and I can’t think of a positive catalyst other than possible strong performance from the Nasdaq. My next price level is 23,390. Still hodling with the crypto fam, though.

matchbox (Bethesda, MD)
∙ Holy Grail Margherita: (Crushed Tomatoes, Basil, Shredded Mozz + Fresh Herb Mozz. Add Pepperoni) ∙
Okay first of all, I have an embarrassing confession to make. I’ve avoided this DC area restaurant chain for no good reason. Mostly because I thought it was stupid that they had a name and logo so similar to a local realty company. Who’s stupid now? Never judge a book by its cover.
I feel like you can’t accurately gauge a pizza after delivery. It continues to cook in the box and then the insulated delivery bag before it cools. It’s literally all wrong for judging their work. When it arrived to the office, we reheated the pizza in the toaster oven. It was great! I’ll revisit to have a pie in person, but still disappointed in myself for avoiding it because I found the restaurant name to be lame. I hedged my bets though – I added pepperoni to the pie because I expected delivery to ruin it. The cupped ronis were money. Nice pie, worth another try.

Flag
Flag • May 13
Friday the 13th brings good tidings! Gap up and hold into the weekend feels great. We’re watching Monday for confirmation.
SPY revisited the downtrend from the beginning of the year; it’s easy to be convinced you’re in a bear market (I know bear = 20%, QQQ is already there). I don’t think ~385 is the low: along this ride you will see rip your face off rallies and bear flags (charting pattern of a minor uptrend within a larger downtrend which gets sold off heavily, appearing like a flag on a chart). The rest is down. Yes – things are washed out, and need to bounce. Charts work the same inversely: all rallies (up or down) need to breathe.
Okay be positive – I think this week sets up well. Let’s get a nice bear flag on a move to SPY 410. A lot of recent volume around 413 (volume profile can be an easy picture of supply/demand, but doesn’t define it). That’s your near term pivot. I got cute and copied the exact same arrows on the chart. Let’s see if the flag plays out, or if we carry through.
Note – play QQQ (ETF tracking Nasdaq 100) for beta (measurement of one security’s volatility to the overall market). QQQ beta approx 1.115, and 1.09 since covid (shout out to my boy, Josh). Higher beta (>1) outperforms the market (upside and down). Although these types of names aren’t en vogue, they are the most beaten up, which rip hardest in bear market rallies.
Considering the SPY downtrend resumption, I added fibonacci’s and new levels to the chart on Monday. These are theoretical…unless (until?) they’re not. Retirement portfolios prefer the theoretical case. Weekly levels are drawn around large volume points, consolidation periods, and/or interesting candle wicks.
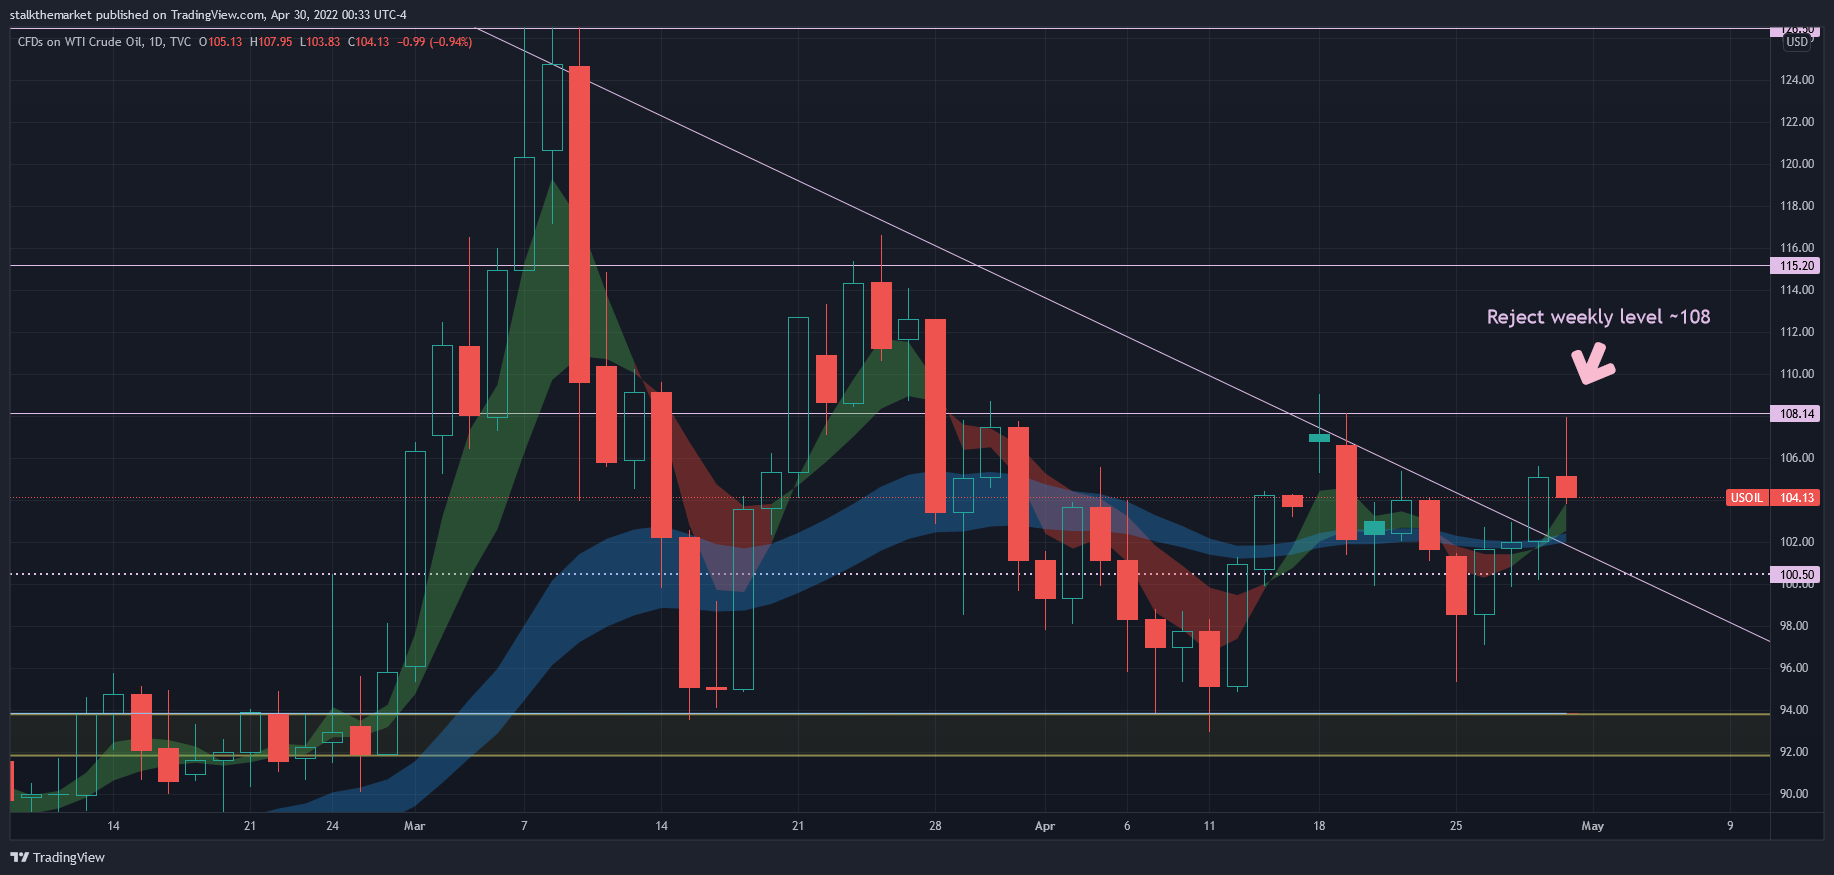
Oil – yet another retest of that 110 level. What I thought was another test and breakout of the 108 level proved to be resistance at 110, the .5 level on the fibonacci. I still think you see a breakout here. Remember, impending China open (whenever that may occur), is a tailwind. Look at the equity charts, they look strong.
BITCOIN – FIRST BTC CHART let’s go. I charted BTC Monday when it was breaking down. It appears as if it wants to hold the weekly lows of ~28,600. Honestly who cares. It’s a risk asset which is trading in tandem with the Nasdaq. Even though Luna/Terra was a stable coin event, it proves something. Crypto is still highly speculative, and should be treated as such from an investment perspective. I’m long crypto and averaging into the dips. Crypto winters suck, and this one may last as long as QQQ bear does unless something changes. If we get a push towards 20k BTC, you apparently get margin calls on firms like MSTR, which would be structurally negative. As of now, all you can do is hope. Let’s play like it wasn’t always hope. Ehem, HODL.
Trap
Trap • May 6
The yellow arrows proved to be a lucky call. Once I put something on the chart, it remains in its original form and eventually gets deleted. I’ll leave all the junk on the chart to see how well my perceived trends persist.
The market firmed up from the recent lows early this week, then ripped following the Fed minutes on Wednesday. In the press conference, Chair Powell said a “75 basis point increase is not something that the committee is actively considering.” I think we saw a short covering rally following the release, trapping bulls into near-term supply (SPY ~428). The market sold off after digesting the news and cluing into the fact that Powell backed himself into a corner. Sure, he can walk back on his comments, but they didn’t warrant the velocity of the Wednesday afternoon move. S&P500 put/call ratio above 1.5 spells short covering to me.
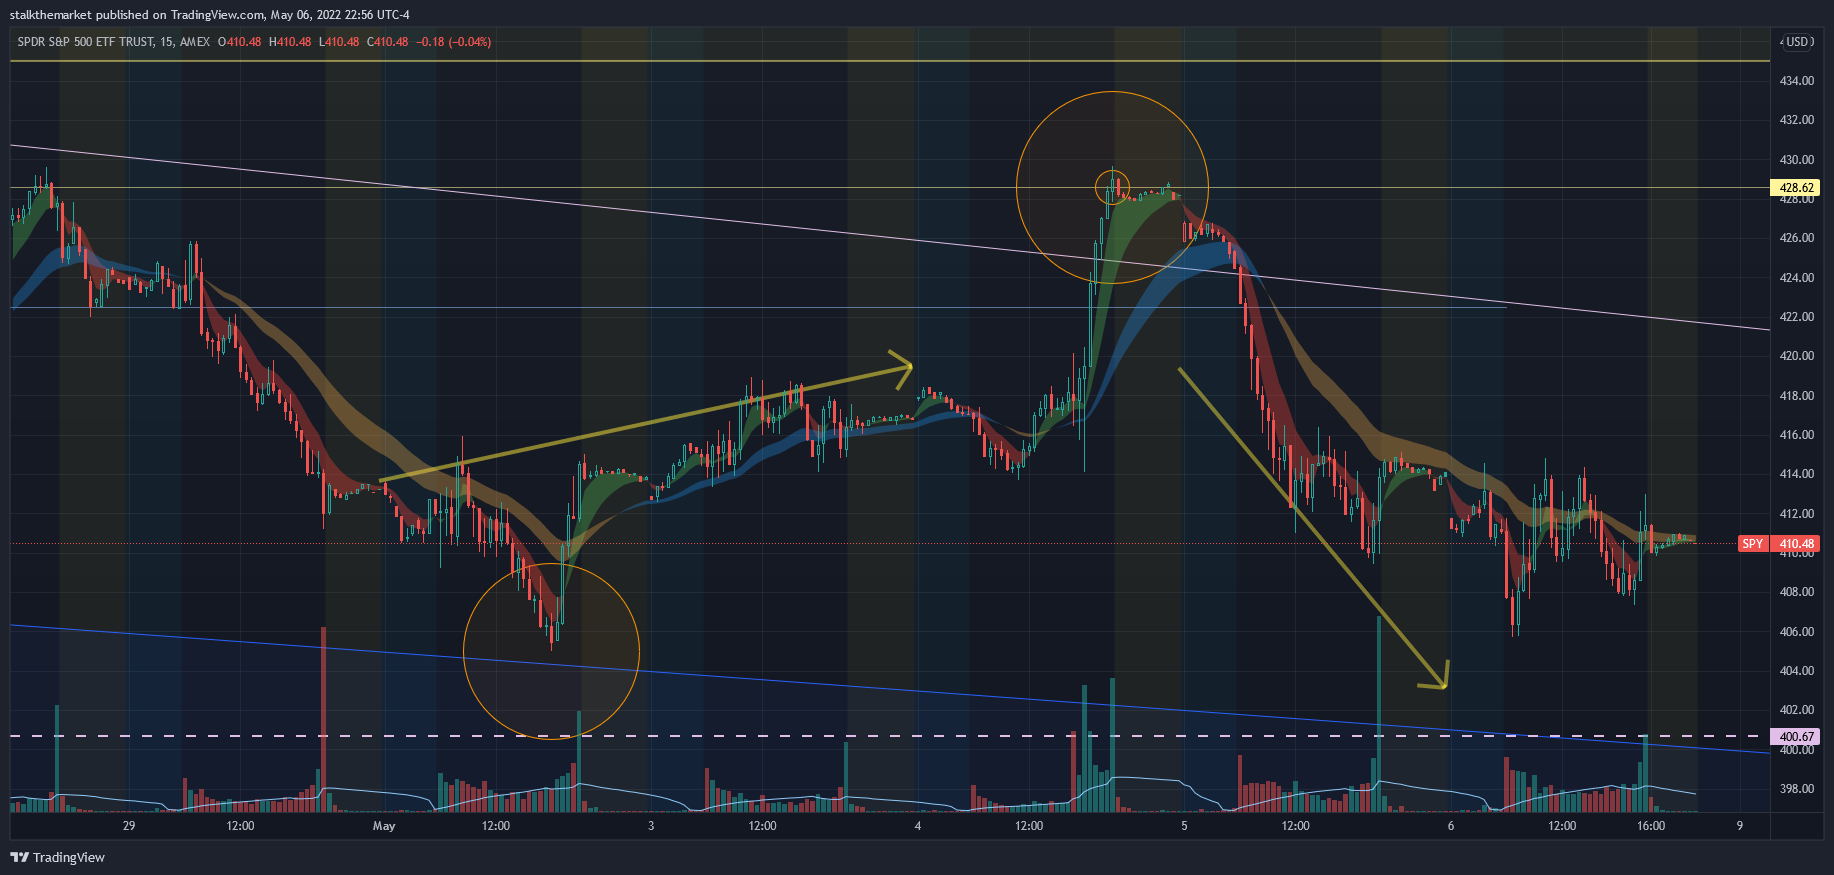
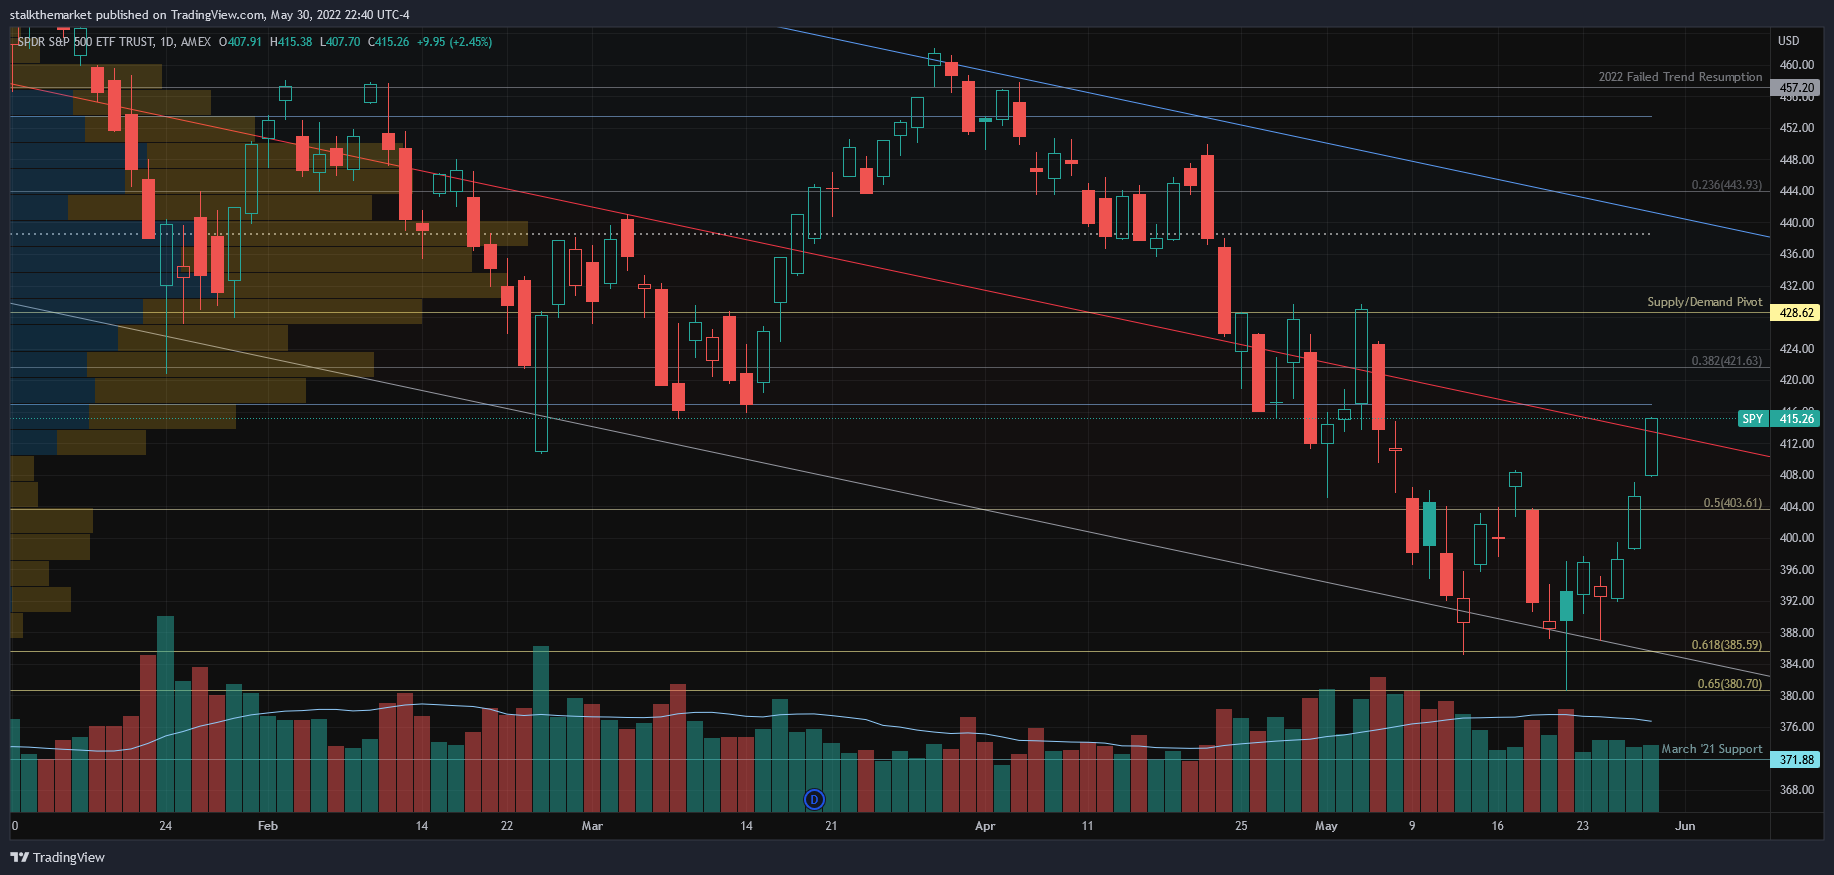
Zoom in – remember, multiple time frame analysis is important if you’re more active than the strict buy-and-hold type. A dip Monday afternoon near my early year downtrend channel was bought up quickly. You can see we failed the 428 SPY level AGAIN into the close Wednesday. This is the third attempt in the past two weeks. CPI data this coming Wednesday. Barring unexpected numbers, I think we see yet another test of the ~428/430 level, and possibly a move to 440 (through yellow channel).
It’s pretty binary. It seems like everyone wants SPY 400…which means 395 (large volume band), and I’ve had a weekly 383 level on my chart for months. I think this precise scenario actually plays out over time, but it may occur swiftly with volatility so strong.
Oil – the equity charts are pushing new highs as oil lifts to 110. Last week it appeared to me that the WTI chart was weakening and the equities may roll with everything else, yet they firmed up well in the face of overall market volatility this week.
I wouldn’t be talking about oil this time a year ago. The best performing stocks YTD: oil companies. Reasonable valuations, strong earnings, (debatable) macro tailwinds, constrained supply dynamics, etc. I traded oil equities on the desk in 2014-15 when oil went from approximately 100-30. Despite its relatively small proportion in the S&P, it is an incredibly important group.
Oil is the kingpin of commodity assets. Various macroeconomic conditions impact supply and influence price. Oil and the market don’t have to trade inversely, although they may in large swings. When oil prices rise to these levels, consumers are constrained, further crimping the economy. Supply dynamics (sanctions on Russian oil) are a tailwind for price. US growth concerns (upcoming recession? Seems like everyone now knows about yield curve inversion) are a headwind for price. China’s covid closure is also a headwind. (Note, China’s closure is also a contributing factor to overall inflation as [not oil, yet consumer & industrial] production growth is falling.)
There’s a political perspective – this is a midterm election year, and high oil prices don’t feel good as voting constituents are hurting at the pump. Sorry everyone, your government officials can’t effect the oil price.
The chart reclaimed my 108 level, which is largely insignificant when you look at the fibonaccis (fibs) on the new chart. From the breakout candle (the base of my yellow channel) to the high at ~130, you can see the confluence between weekly levels and fibs ($100 at the .236 & $115 at the .618). Current price of $110 is at the .50 level. People like to trade round numbers. I’ll save my golden ratio rant for another time, but fibs never cease to impress.
Where does it go? Feels like it wants higher. Keep an eye out – if oil really rips, it could impact your stock market relief rally. If you’re chasing oil equities up here, be tactical.

Fall
Fall • April 29
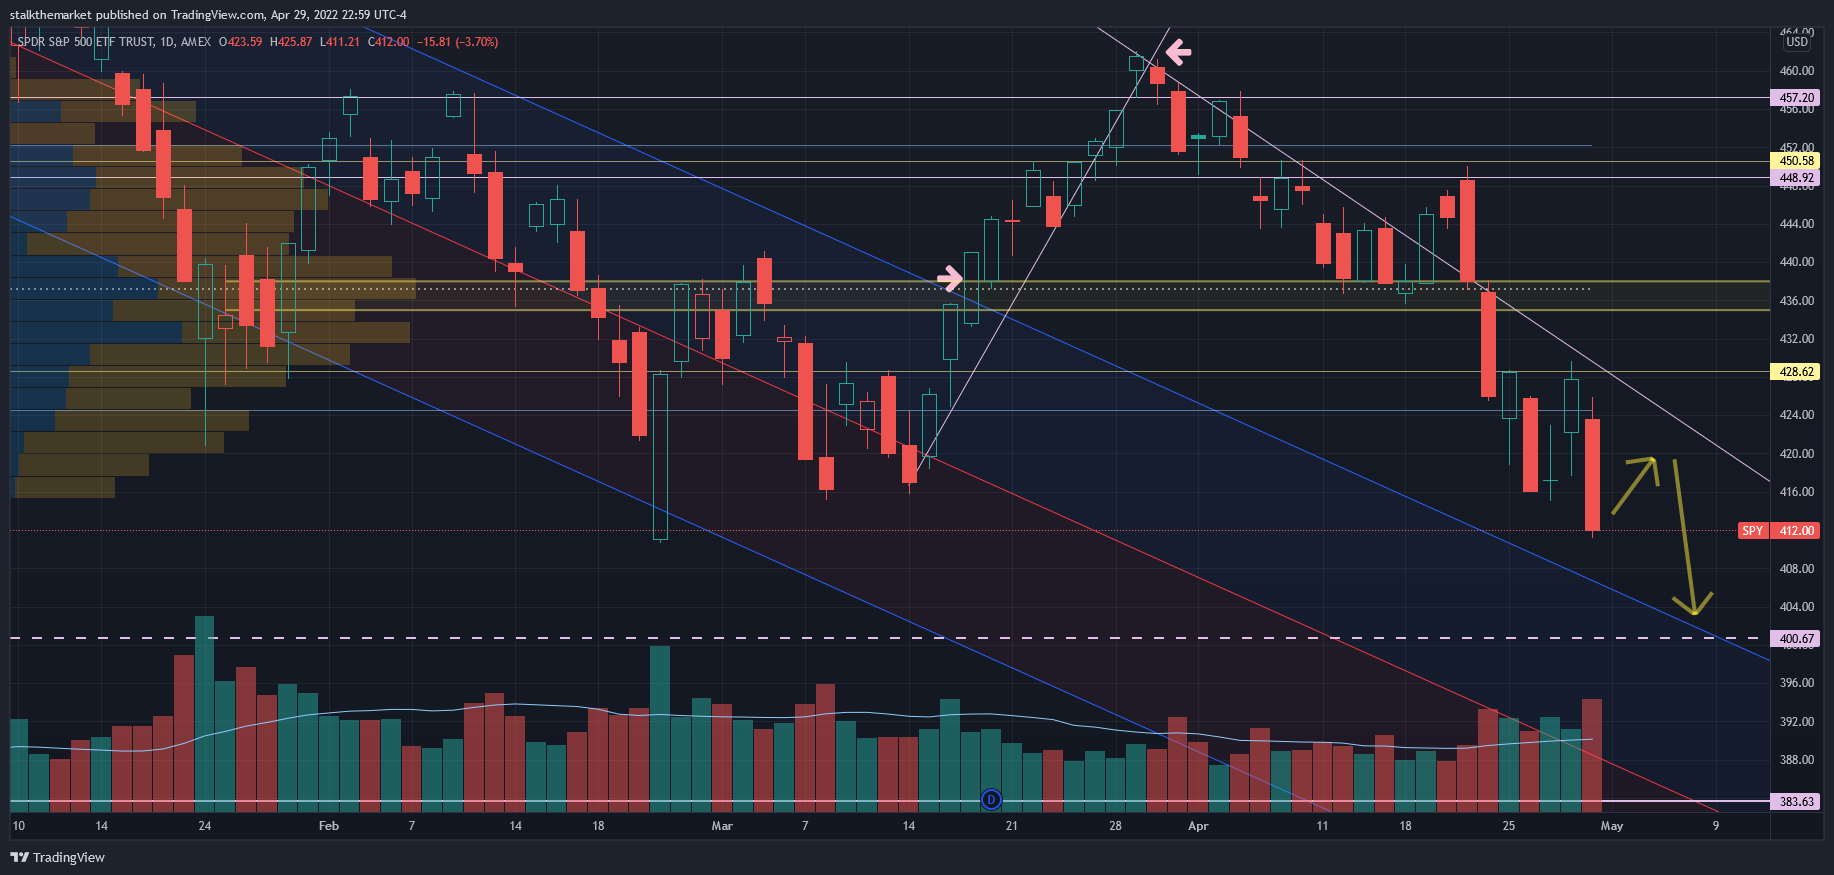
Stair step up, elevator down. The bears are out.
Bull hopes for a retest were blown as SPY 450.01 rejected and the indexes began rolling over hard. I’ve been saying how lucky I am to be long the FAANG names except for FB & NFLX, which concerned me coming into this week’s earnings. Now my Roth IRA core of big cap tech hurts. This was a make or break week for the market, as these stocks make (made? haha, too soon) up a large portion of the indexes.
Everyone is looking for SPY to break 400. The VIX is hot at 33. The seasonally best performing month in the market, this April was the worst since 1970. Funny enough, in 1970 inflation was at 5.5%, before going to 14% over the next decade. Coincidence? Okay how about this. Worst performing month for the Nasdaq since 2008. I don’t have to tell you tech hurts, Cathie can.
Fed meeting coming up this week. I’m praying for a 75 basis point hike. Let’s really go at inflation. Let’s remove the idea that a mid-meeting hike is on the table. How wild would it be if we hiked 75 bps and the market ripped on the news. Anything is possible.
The Fed is here to nuke the market. As your stocks go down, you feel poorer, reducing the ‘wealth effect.’ You slow down spending, the economy slows, and inflation [is supposed to] slows down.
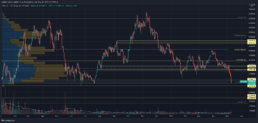
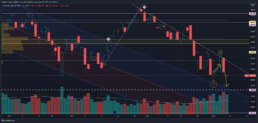
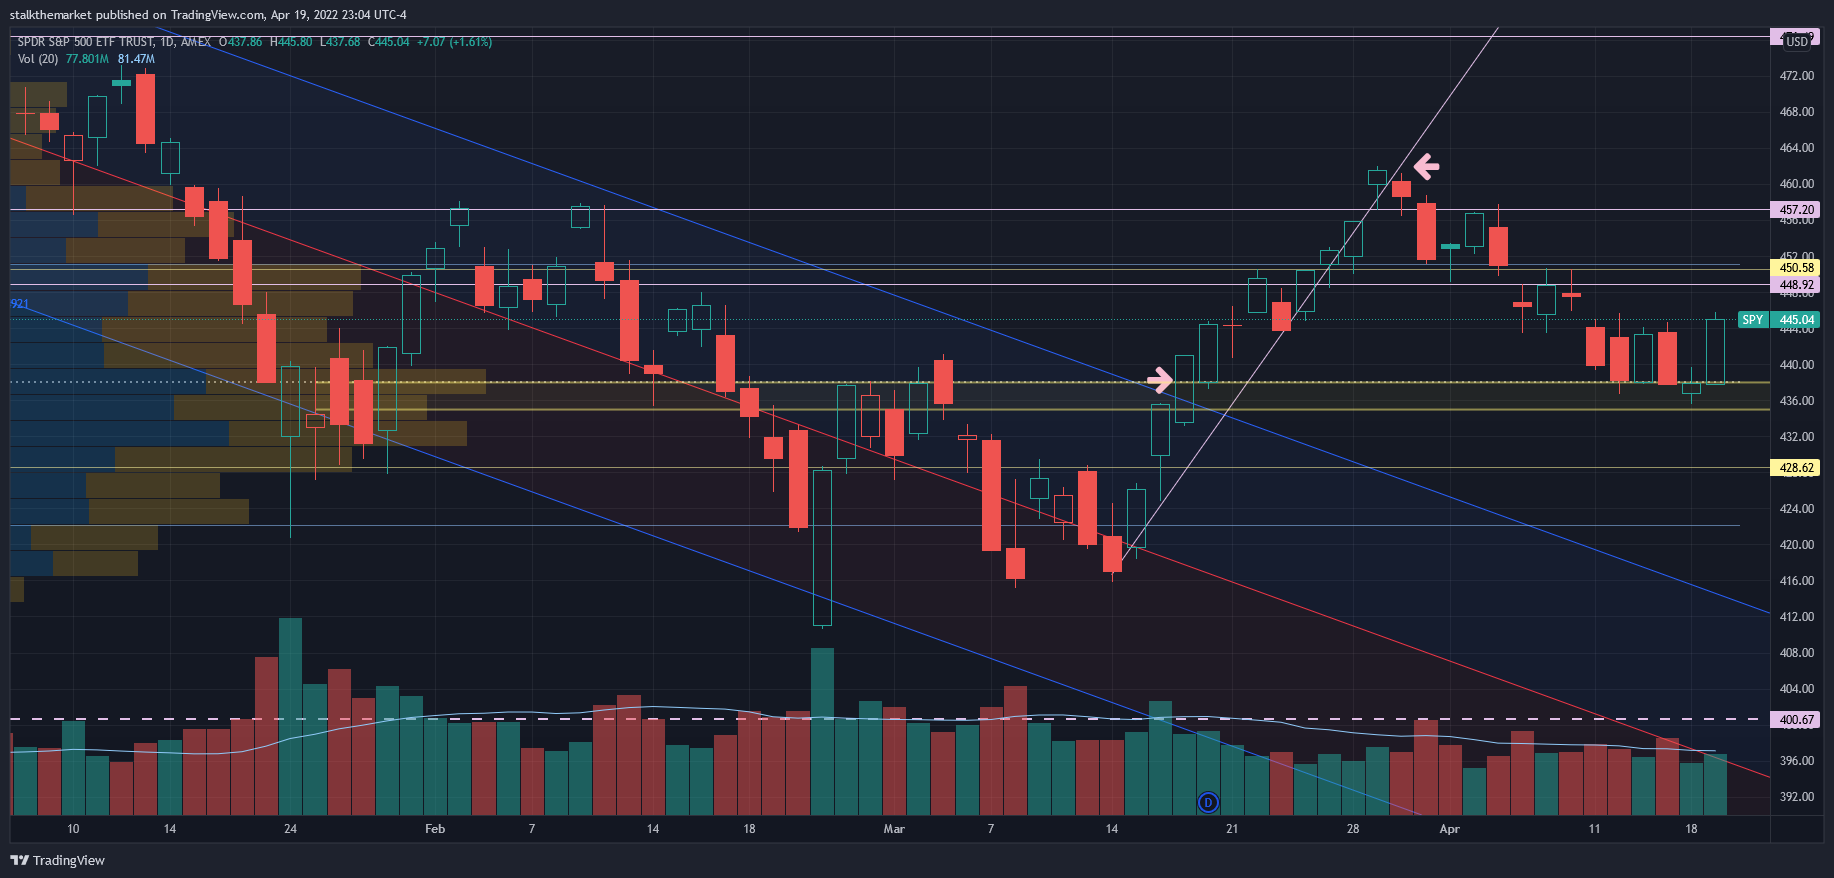
I think SPY breaks 400, and your next volume node is between 390-395. I’ve left the early 2022 channel on the chart, and the market actually looks like it wants to touch that level before looking higher. Chart above from April 19 to show the levels you’ll see below. Since added an upper trendline and some goofy arrows as my best guess. Cool to continue seeing weekly levels respected (fail to take back 428 – yellow line).
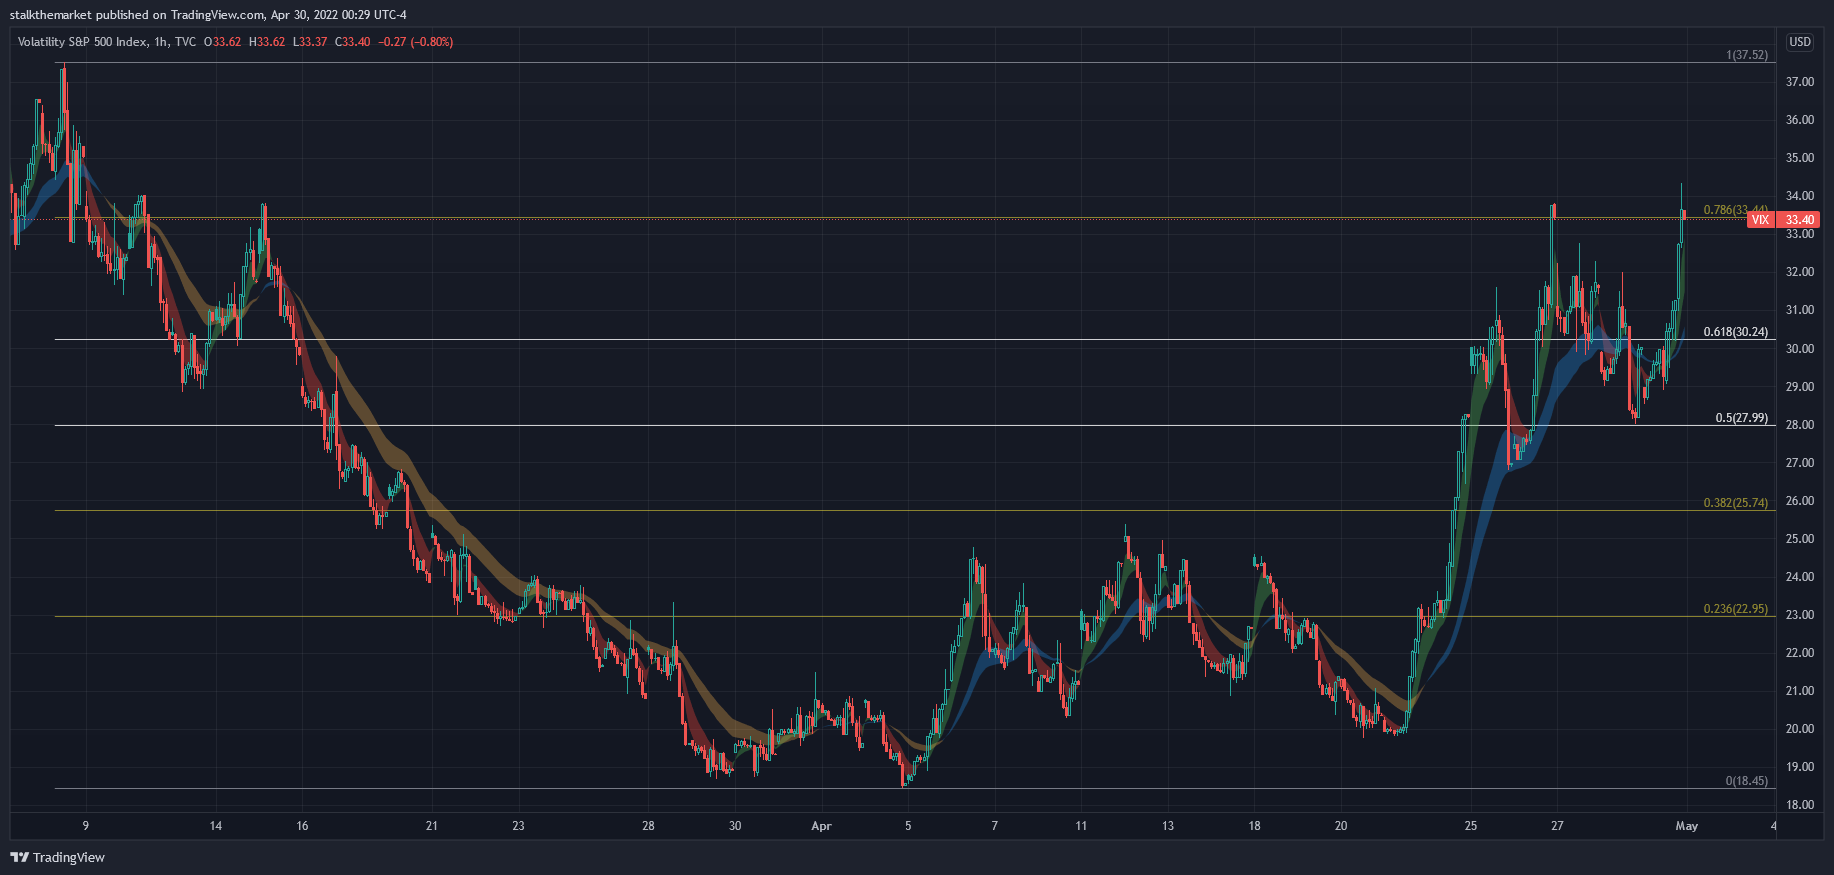
Also fascinating how well Fibonacci’s work on charts. VIX hourly chart going back to February. I’ll get on my golden ratio fanboy session later (but look at the candles touch the levels!). VIX has room to the upside, but you may see a relief bounce in the market in the very short term.
Finally, oil. The equity charts don’t look great – they need to hold, or will roll over with everything else. Mind you, in tough markets, well-performing stocks become sources of funds. High beta stocks will really tumble if momentum takes hold. I like oil long term, but things are rocky right now. That inverted hammer doesn’t look pretty, and forms yet another lower high.