Risk
Risk • February 26
Endurance in the game is directly correlated to taking calculated risks. If you look around, you have plenty of risk. The announcement of Russia’s invasion of Ukraine didn’t seem to shock the markets. The NYSE Floor legend Art Cashin said something to the effect of ‘Sell the news of war and buy the bombs.’ If you think that’s coarse, you’re in the wrong room. Let’s soften it a bit. Counter-trend rally. Short squeeze. Remember, we’re still getting earnings – companies are shining or flaming with the swiftness.
We’re all market participants. Perspective: I’m 35% cash across my retirement portfolios and 100% cash in my day trade/swing brokerage. I day traded upside calls on QQQ expiring today; I’m not adding to my Roth. I’d rather miss upside than catch downside. We’re waiting for trend correction, not rip-your-face-off bear rallies.
Look around at the risk. No need to be verbose – War & Fed. Pithy and poignant. Rapid inflation….a SERIOUS concern. Yeah – I said cash is a position in this market. No, I’m not a bear. I just don’t think we’re through.
Let’s get cute with some lines. I love this game.
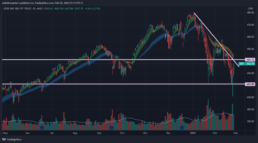
- 1st Chart: Hourly SPY chart with a regression channel. Short term upside to ~450 and resistance at 475. Both psychological levels.
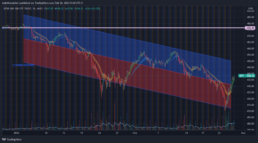
- 2nd Chart: Downtrend line with two of my assumptive ‘trading bands’ on a ‘positive’ basis.
I caveat the 2nd chart’s horizontal levels only because I think the SPY wants 400. It’s a nice psych level amidst a shaky market with rapid inflation and waning consumer confidence. Do the fading covid memories assist the CC picture? Of course. However, let’s not forget the stock market element of household wealth and influx of market participants in the past couple years.
Reminder: cash is a position, and in the summer we’ll likely have a lot more clarity. I’m waiting for a few more rate hikes, and now, more development out of Eastern Europe.
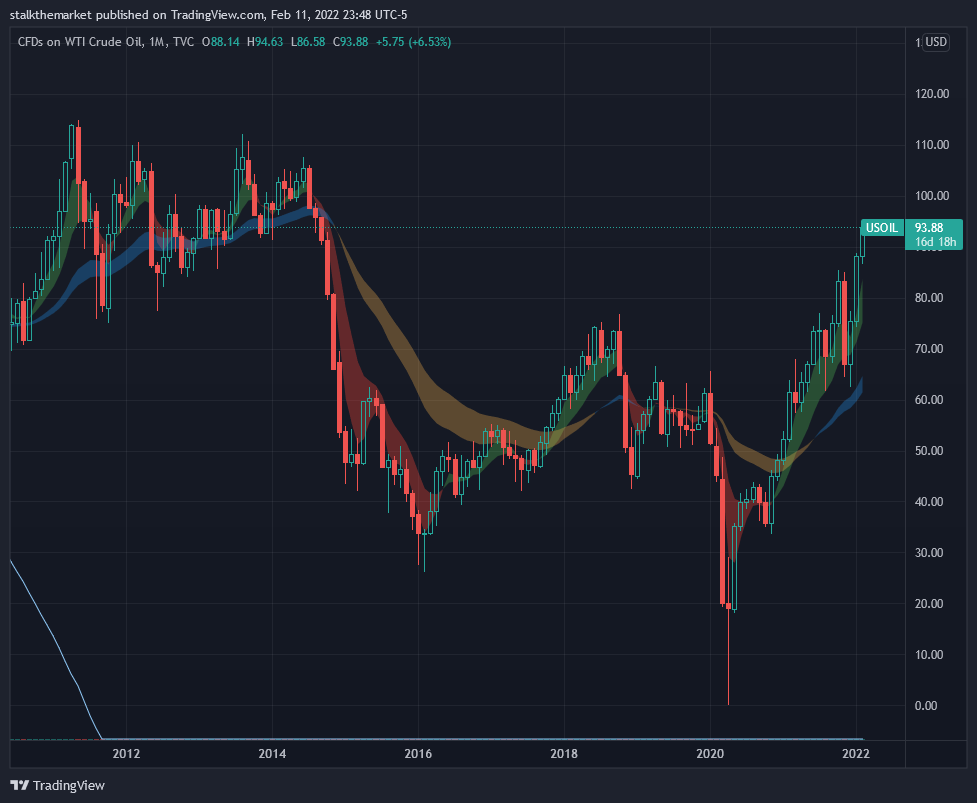
Ooh ooh – oil?? Toppy? Too much macro going on to tell – consolidation at (okay, near) the ~100 level is anyone’s guess as to breakout vs breakdown. Recent high at 100 and a half on the following WTI monthly chart. Longer term resistance at the 110 level. I’m bullish on the economic recovery and ensuing oil demand. That said, it’s my opinion that she needs to breathe a bit.

Inception
Inception · February 12
The trend is breaking down, my friends. Thank Bullard for his Thursday 2/10 100 bps by July comments. Thank the news on Friday about impending doom in Eastern Europe. Everyone thought we had until at least the end of the Olympics.
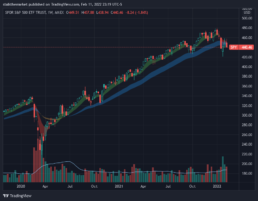
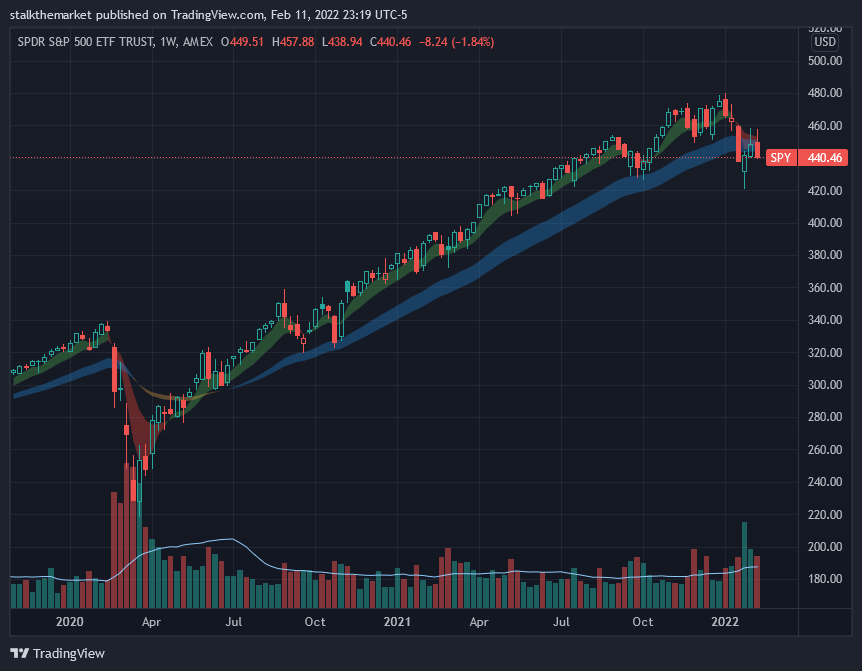
S&P500 (SPY) failing to hold on a weekly basis (EMAs rolling over), and critically breaking down on an intraday basis. Cash is a position in this market.
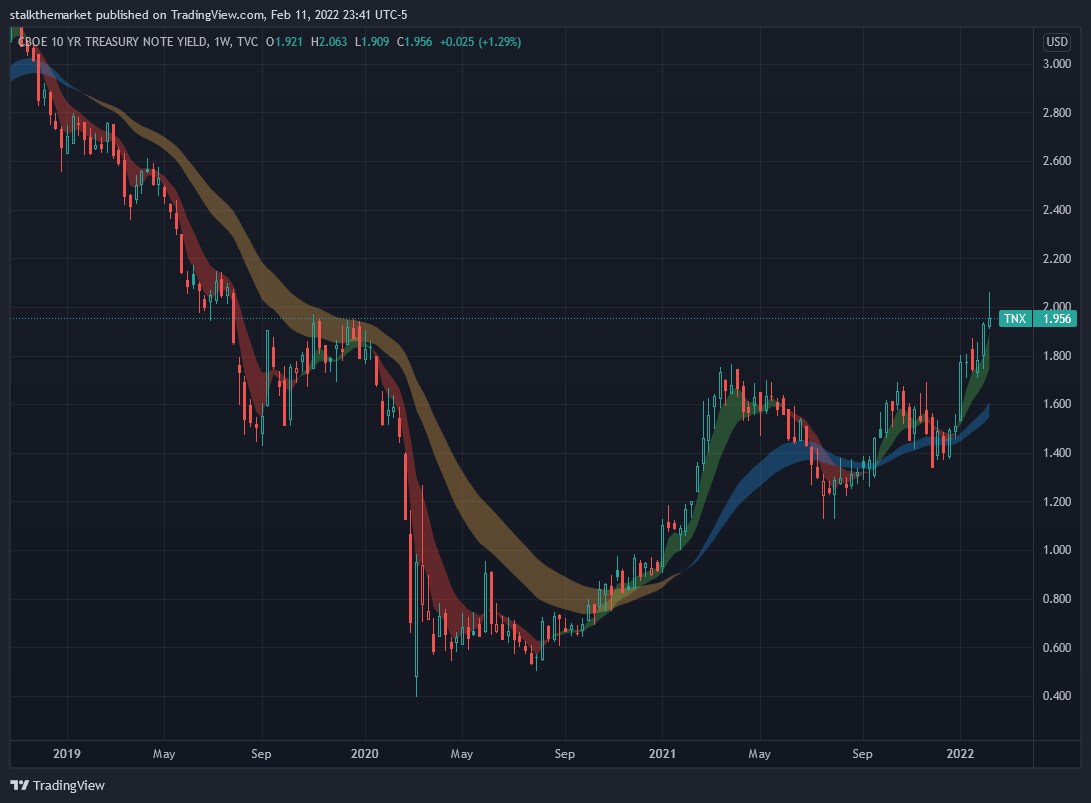
US10Y yield and the price of WTI have been on the radar for a while now. 10Y weekly and oil monthly below. Obvious questions: does the 10 yr consolidate at 2% until the next Fed meeting? How long does it take oil to get to 100, and then what?