

One Treasury Maturity Hits a Rare Short Extreme While the Fed Meets Next Week
The 10-Year Treasury is the only market on the board where dealers sit at a true extreme this week, and it got there while the 5-Year went the other way. As of Tuesday, 10-Year dealers held one of the deepest net shorts in their two-year range, while 5-Year dealers pulled back sharply from theirs. Two maturities that usually move together are telling different stories.
For anyone with a bond fund, that matters because the Fed’s rate decision (the FOMC meeting, October 28) and PCE (the Fed’s preferred inflation measure, October 29) land back to back, and the 10-Year is the maturity behind intermediate funds like IEF and a large share of BND. The big asset managers hold the other side of the 10-Year at the top of their own range, so this looks more like institutional hedging than a one-way bet.
This is Tuesday’s picture. Since then stocks have had a rocky week, with the Nasdaq down nearly 2% and the VIX (the market’s fear gauge) jumping from about 17 to near 20, while Treasury prices rose, which means yields eased. Headlines pointed to bond traders backing off bets on Fed rate hikes. None of that shows how dealers behaved after Tuesday; next week’s report is the first that can.
This Week's Positioning
5-Year Treasury: dealers covered a big chunk of their short
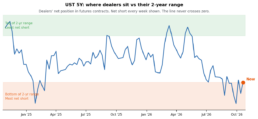
Five-year dealers reduced their short sharply for a post-options-expiration week, moving from a stretched short back to a moderate one (z=-1.24), though they remain in the bottom tenth of their two-year range. The hedge fund crowd is still net short but carries less of a short than usual, and has been trimming it for weeks. For a regular investor this reads as pressure easing in the middle of the curve, not as a signal about where yields go next.
Watch: the Fed decision on October 28, the first big event to test whether the 5-Year’s calmer footing holds.
10-Year Treasury: the one extreme left on the board
Dealers stepped up from a stretched short into the board’s only extreme reading (z=-2.19), which puts them in the lowest few percent of their two-year range. The options side of the dealers’ book leans the opposite way, so dealers may be hedging against what asset managers hold rather than taking a clean directional position. Yields eased a bit since Tuesday, but that says nothing yet about how dealers moved.
Watch: PCE on October 29, the next inflation reading, followed by the jobs report on November 6.
Gold and crude oil: hedgers moved up a tier
The producers and merchants who hedge physical gold and crude (the Commercials) both stepped from a moderate to a stretched reading this week. Gold Commercials are still net short, just less than usual, while crude Commercials are genuinely net long, unusual for a hedger book, with the speculative crowd long alongside them. This describes who holds what and nothing more; commodity positioning has no proven link to the next price move. Since Tuesday gold has slipped about 3% to near $4,010 and silver has dropped more than 6%.
Watch: next week’s report, due Friday October 30, to see whether gold hedgers hold their new tier after the price slide, which matters most if you own GLD or SLV.
Elsewhere: Nasdaq dealers added to their short at an unusually fast pace and now sit in a moderate short, with the Nasdaq the weakest major index since Tuesday. Russell 2000 dealers slid back to neutral on heavy flow, and the S&P 500 is quiet. In the euro, the hedge fund crowd holds the most bearish stance in its two-year range, and dealers are net short too, so both sit on the same side with asset managers holding the long. British pound dealers eased from stretched to moderate on unusually heavy flow, and SOFR futures (the market’s bet on short-term interest rates) saw dealers ease a tier as well. Small traders in the 2-Year Treasury have pulled back to the low end of their usual long, which suggests retail money is sitting this one out. Bitcoin dealers’ thin long is still at the bottom of its range, and institutions remain deep sellers of VIX protection even after the fear gauge’s jump. Copper and natural gas are background.
Know Where You Stand
- Look up the average duration of your bond fund before the Fed meets on October 28. Duration, listed on the fund’s own page, tells you roughly how much the price moves for each one-point change in yields, so SHY, IEF and TLT can react very differently to the same Fed message.
- Nothing in this data calls for a change to your stock funds, and here is what would. Nasdaq dealers are drifting toward a stretched short, so if next week’s report shows them past that line while QQQ keeps sliding, take it as a cue to check how much of your account sits in tech.
- Know the size of any gold, silver or oil fund in your account. Silver fell more than 6% in three days, so whether you hold GLD, SLV or USO, decide ahead of time what share of your portfolio those swings can touch.
Data: CFTC COT Report 2026-10-20 | Prices as of 2026-10-23 | 104-week lookback