

Smart Money Pulse - '26 W38
Rate Desks Went to an Extreme, Then the Tape Rallied Without Them
The heaviest money of the week went into the 2-Year Treasury. Dealer desks dropped two full steps, from a middling short position down to the bottom of their two-year range (z=-2.04), on one of the biggest position shifts on the board. They did it the day before the Federal Reserve raised rates.
For a regular portfolio that lands on the short and intermediate part of the bond sleeve, the part most people own through a core bond fund like BND or a short-dated fund like SHY without ever thinking about it. The professional money is arranged around the path of policy from here, not around the hike that already happened, and the next scheduled test is PCE, the Fed’s preferred inflation measure, on September 25.
All of this is a Tuesday photograph and you are reading it on Friday. Since the snapshot the Fed hiked and the market treated it as good news: the Nasdaq ran more than three percent, the S&P 500 gained close to two, Bitcoin added about seven, the fear gauge slid to the mid-14s, the dollar firmed and crude oil fell nearly ten percent. None of that tells you anyone moved their position. The next honest look at positioning is next week’s report.
This Week’s Positioning
The 2-Year Treasury: dealers sank to the floor of their range one day early

Dealers and the hedge fund crowd now sit at opposite ends of their own two-year histories here, which is as much tension as this data measures; both are still net short the contract itself, so the opposition is about where each group sits versus its own norm, not about one side betting against the other outright. Small traders, the cohort your own account belongs to, have gone the other way and largely backed out of this market. This describes how the front end of the bond market is arranged right now, nothing about where yields go.
Watch: the PCE inflation report on September 25. That is the first scheduled number that speaks directly to this book, and a regular investor feels it through short-dated bond funds and the cash sleeve.
The long end of the bond market: the fast money piled into the top of its range
At 30-year maturities the hedge fund crowd stepped two tiers higher in a single week and now sits near the top of its two-year range (z=+2.01), and it has been adding steadily for weeks. Dealers on the other side are nowhere near stretched, so this is a one-sided crowd rather than a standoff, and a crowded position is a fact about who owns what, not a signal about direction.
Watch: whether long-dated bond funds like TLT keep sliding now that the hike has landed. Long maturities are the most rate-sensitive thing in a typical portfolio and they are where this particular crowd lives.
The U.S. dollar: the stretch came out, and the big institutions and the fast money split
Dealers released a large piece of their dollar-index stretch this week on one of the bigger position shifts on the board, dropping out of a stretched posture back toward the middle. What is left is a genuine disagreement: the big asset managers are holding a dollar-bullish position near the high end of their range (z=+1.02) while the hedge fund crowd cut its own dollar bet to roughly flat and leans against the currency elsewhere.
Watch: whether the dollar index holds above 100 in the weeks after the hike. A firmer dollar quietly drags on unhedged international funds and on commodity prices; UUP is the closest thing a retail account can hold to the index itself.
Bitcoin: the speculative crowd got more crowded while dealers thinned out
The hedge fund crowd moved up another tier and now sits near the top of its two-year range (z=+1.61), while the dealer position, which in crypto is structurally a long, sits near the low end of its own range. That is the sharpest crowded-versus-thinning arrangement outside the bond market, and the tool reads it as crypto-specific rather than a broad risk signal, since nothing similar shows up in stock positioning.
Watch: whether Bitcoin holds the low-80,000s after this week’s run. Most people now own this through a spot ETF like IBIT rather than directly, which makes the position easy to forget about.
Everything else is doing less than the headlines suggest. Large-cap stock positioning drained back toward its average: S&P 500 dealers released their mild stretch entirely, and the Nasdaq book crossed the neutral line with dealers easing short and the fast money easing long, a repeat of an arrangement that has flipped back and forth for weeks without either side reaching a stretch. Small caps still carry the most one-sided speculative short on the equity board against an outright dealer long, though it eased a notch and is now background rather than news. Short-term rate futures, the market’s bet on where policy goes, remain the one contract where both professional groups sit at historical extremes in opposite corners, and nearly two fifths of the speculative side there is tied up in roll and calendar trades with no directional opinion. Currencies produced a lot of motion and little conclusion: the Japanese yen saw the largest weekly flow on the board for a second straight week, this time reversing the prior week’s reset, while the Mexican peso, Canadian dollar, euro, British pound, Swiss franc and Australian dollar all shuffled without landing anywhere decisive. Institutions kept showing unusually little interest in owning volatility protection. In commodities, the physical-market hedgers in copper backed off a tier of their hedge while the speculative crowd stayed leaning long, and gold, silver, crude and natural gas show the familiar hedger-versus-speculator gap with nothing at a genuine extreme.
Know Where You Stand
- Find out what your cash is actually paying now that the Fed has moved. Settlement funds, money-market funds and Treasury-bill holdings all reprice off the policy rate, and the most crowded professional books on the board sit in exactly these short-dated contracts; pull up the current yield on your brokerage’s default cash sweep and compare it against a bill fund like BIL, because the gap between the two is often wider than people assume.
- Crude oil fell almost ten percent since Tuesday, and that shows up in your account before it shows up at the pump. Energy is a meaningful slice of most total-market funds and the dominant one in a sector fund like XLE, so if your energy holdings lagged while the rest of the market rallied this week, this is a likely reason; nothing here calls for a trade, it is worth knowing where the drag came from.
- The stock side of this report is asking nothing of you this week, and that is the useful finding. Equity positioning is close to its two-year average across large caps, so there is no structural warning to act on; if you want a date rather than a feeling, PCE on September 25 is the next event that lands on the crowded books, and that is a reasonable point to review your allocation rather than reacting to the post-Fed rally.
Data: CFTC COT Report 2026-09-15 | Prices as of 2026-09-18 | 104-week lookback
Liquidity Trajectory '26 W38
LIQUIDITY TRAJECTORY
CFTC Report Date: 2026-09-15 | Generated: 2026-09-18 16:13 ET
EXECUTIVE SUMMARY
- The rates curve is the board’s stress center and duration got heavier into the Fed. UST 2Y dealers dropped two tiers from MODERATE to EXTREME SHORT (z -1.19 to -2.04, the 1.0th percentile) on the largest single repositioning of the week (WoW -92,432, event z -2.75^), while UST 10Y dealers extended their EXTREME SHORT to z -2.78 at the 0.0th percentile (WoW -84,962, flow z -2.00). Three of twenty-four groups sit above |z| 1.5 and all three are rates. The 2Y carries an options caveat (OptZ=+0.87), so read that extreme as a basis or directional footprint; the 10Y carries options corroboration (OptZ=-1.47), the one place the options-hedging hypothesis has support this week. Measured realized vol runs 1.13x the all-week average in the 2Y regime (n=58) and 1.00x in the 10Y (n=57).
- Leveraged funds are now crowded at the top of their range across three tenors at once. UST 5Y sits at the 99.0th percentile (lev z +2.08, adding ~51,105/wk), UST 30Y stepped two tiers from MODERATE to EXTREME LONG (z +1.37 to +2.01, 96.2nd percentile), and UST 2Y holds the 95.2nd percentile against the dealer extreme. All three remain net short in absolute contract terms; the z reads their posture versus their own range. SOFR 3M is the board’s only OPPOSED EXTREMES book, dealers at the 98.1st percentile on an outright +3,524,755 long against leveraged funds at the 4.8th percentile, with 37.7% of leveraged gross exposure in spread structure and an options caveat (OptZ=-3.20).
- The yen book turned over violently for a second straight week, this time in the opposite direction. JPY dealer flow printed the board’s largest deviation by a wide margin (event z -7.89^, flow z -7.27, WoW -129,093), carrying dealers from NEUTRAL to MODERATE SHORT yen (z +0.20 to -1.00) while leveraged funds swung two tiers the other way into an ELEVATED LONG yen at the 94.2nd percentile (z -0.29 to +1.63). The peso is the other aggressive FX book: MXN leveraged funds stepped to EXTREME LONG at the 99.0th percentile (z +2.06) on dealer flow the tool flags as outsized (event z +2.13^).
- Equity positioning rolled toward tech shorts while the small-cap squeeze setup eased a tier. Nasdaq dealers crossed from NEUTRAL into MODERATE SHORT (Consol z -0.21 to -0.62) as leveraged funds crossed the other way into MODERATE LONG (z +0.04 to +1.00), and S&P 500 dealers released MODERATE LONG back to NEUTRAL (z +0.58 to +0.40). Russell 2000 leveraged funds eased a tier to ELEVATED SHORT (z -2.03 to -1.52), against a genuine dealer long of +80,602 contracts at the 90.4th percentile carrying the equity concentration flag (25L/24S #). Group equity dealer average is +0.30z.
- Catalyst line: the FOMC hiked Wednesday Sep 17, two days after this Tuesday snapshot and one day before publication, landing directly on the SOFR, 2Y and 5Y books that already carry the board’s crowding. PCE follows Sep 25, seven days out, on the same front-end complex, and NFP lands Oct 2, fourteen days out, on the front end and the dollar ledger.
SINCE THE SNAPSHOT
This brief reflects positioning as of the 2026-09-15 Tuesday snapshot; the price moves below are current through Friday September 18 and run on a different clock. Price action does not confirm any repositioning.
| Market | Since Tue | Level/Note |
|---|---|---|
| S&P 500 | +1.67% | ES=F, broad risk-on |
| Nasdaq | +3.33% | NQ=F, the strongest major |
| Russell 2000 | +0.33% | RTY=F, small caps lagged |
| VIX | -13.78% | ^VIX 14.81, fear gauge back to the mid-14s |
| Bitcoin | +7.13% | crypto led the tape |
| Ether | +9.73% | the largest gain on the board |
| UST 10Y | -0.40% | ZN=F futures down = yields up |
| UST 2Y | -0.39% | ZT=F futures down = front-end yields up |
| Dollar Index | +0.55% | DX-Y.NYB, USD up |
| JPY | -0.67% | 6J=F down = yen down vs dollar |
| Copper | +5.47% | HG=F, metals complex firm |
| WTI Crude | -9.64% | CL=F, the largest decline on the board |
The FOMC decision was released Wednesday and the Fed hiked, and the tape read it as a growth-positive outcome rather than a tightening scare: front-end and long-end futures both slipped, tech and crypto rallied hard on renewed AI chip demand and post-CLARITY regulatory clarity, the fear gauge collapsed and the dollar firmed. Crude broke sharply lower on the same stretch. All of this is price action after the Tuesday snapshot and none of it confirms dealer, leveraged fund or asset manager repositioning. The next positioning data is not visible until next week’s report.
POSITIONING TABLE
| Rank | Market | Signal | Dlr Z (prior to cur, Δ) | Lev Z (prior to cur, Δ) | Regime (+ transition) | Key Detail |
|---|---|---|---|---|---|---|
| 1 | UST 2Y | REGIME STEP TO EXTREME + OPPOSED EXTREMES | -1.19 to -2.04 (Δ -0.85) | +2.48 to +2.37 (Δ -0.11) | dlr MODERATE to EXTREME SHORT; lev EXTREME LONG (held) | dealer 1.0th pctl, net -536,280, WoW -92,432, event z -2.75^; lev 95.2nd pctl but net -1,294,575, still short in absolute terms; AM z -1.61 at 8th pctl; small traders z -1.72, washed out; RV 1.13x (n=58); OptZ=+0.87 caveat |
| 2 | UST 10Y | DEEPEST DEALER SHORT ON THE BOARD | -2.29 to -2.78 (Δ -0.49) | +0.17 to +0.40 (Δ +0.23) | dlr EXTREME SHORT (held); lev NEUTRAL (held) | dealer 0.0th pctl, net -719,408, WoW -84,962, flow z -2.00, event z -1.94^; AM long 99th pctl (z +1.84) on +2,634,980; Other Reportables z -1.97 at 0th pctl; RV 1.00x (n=57), no amplification; OptZ=-1.47 corroborates |
| 3 | SOFR 3M | OPPOSED EXTREMES, BOTH SIDES HELD | +2.64 to +2.41 (Δ -0.23) | -2.16 to -2.08 (Δ +0.08) | dlr EXTREME LONG (held); lev EXTREME SHORT (held) | dealer 98.1st pctl, outright +3,524,755, WoW -168,270; lev 4.8th pctl on -2,774,148; AM z -1.97 at 1st pctl; 37.7% lev gross in spread structure; OptZ=-3.20 caveat; 92L/92S # |
| 4 | JPY | BOARD-LARGEST FLOW, BOTH COHORTS CROSSED | +0.20 to -1.00 (Δ -1.20) | -0.29 to +1.63 (Δ +1.92) | dlr NEUTRAL to MODERATE SHORT; lev NEUTRAL to ELEVATED LONG | event z -7.89^, flow z -7.27, WoW -129,093; dealer 18.3rd pctl, net -168,570 (short yen); lev 94.2nd pctl, net +23,170 long yen, adding ~35,373/wk; AM z +0.45; Other Reportables z +1.00; OptZ=-0.95 |
| 5 | UST 5Y | LEV CROWDED LONG, TOP OF RANGE | -1.47 to -1.45 (Δ +0.02) | +1.98 to +2.08 (Δ +0.10) | dlr MODERATE SHORT (held); lev ELEVATED to EXTREME LONG | lev 99.0th pctl, adding ~51,105/wk, net -1,986,928 still short outright; dealer 5.8th pctl, net -855,342, flow z +0.03; AM z -1.23 at 8th pctl; small traders z -1.58; RV 1.11x (n=245); OptZ=-1.11 |
| 6 | UST 30Y | LEV STEPPED TWO TIERS AT THE LONG END | -0.87 to -0.69 (Δ +0.18) | +1.37 to +2.01 (Δ +0.64) | dlr MODERATE SHORT (held); lev MODERATE to EXTREME LONG | lev 96.2nd pctl, adding ~29,986/wk, net -211,735; dealer 26.9th pctl, net -241,670, 4 straight weeks of net increase; AM z -0.96; Other Reportables z -2.44 at 1st pctl; top-4 35.1%; OptZ=+0.75 |
| 7 | Nasdaq (Consol) | REGIME TRANSITION, COHORTS CROSSED IN OPPOSITE DIRECTIONS | -0.21 to -0.62 (Δ -0.41) | +0.04 to +1.00 (Δ +0.96) | dlr NEUTRAL to MODERATE SHORT; lev NEUTRAL to MODERATE LONG | dealer 30.8th pctl, net -69,952, WoW -12,350, flow z -1.80^, event z -1.49; lev 84.6th pctl but net -13,052, short in absolute terms, adding ~7,494/wk; AM z -0.08; OptZ=-1.74; Mini dlr -0.39 to -0.82 (Δ -0.43), Mini small traders z +0.84 at 83rd pctl |
| 8 | MXN | LEV STEPPED TO EXTREME ON OUTSIZED DEALER FLOW | -1.85 to -1.06 (Δ +0.79) | +1.86 to +2.06 (Δ +0.20) | dlr ELEVATED to MODERATE SHORT; lev ELEVATED to EXTREME LONG | event z +2.13^, flow z +2.70, WoW +34,661; dealer 13.5th pctl, net -93,766 (short peso); lev 99.0th pctl, net +90,008 long peso, adding ~7,105/wk; AM z +0.58; top-4 62.5%; OptZ=+0.60 |
| 9 | Russell 2000 | LEV SHORT EASED A TIER, DEALER LONG CONCENTRATED # | +1.26 to +1.11 (Δ -0.15) | -2.03 to -1.52 (Δ +0.51) | dlr MODERATE LONG (held); lev EXTREME to ELEVATED SHORT | dealer 90.4th pctl, genuine outright long +80,602, top-4 18.3% on a flagged 25L/24S # book; lev 5.8th pctl, net -97,203; AM z -0.42; Other Reportables z -1.22 at 6th pctl; RV 0.92x (n=102); OptZ=-0.61 |
| 10 | USD Index | STRETCH RELEASED, BUY-SIDE SPLIT | -1.90 to -0.99 (Δ +0.91) | +1.07 to -0.15 (Δ -1.22) | dlr ELEVATED to MODERATE SHORT; lev MODERATE LONG to NEUTRAL | flow z +2.48, WoW +11,642, event z +1.48; dealer 21.2nd pctl, net -15,204; AM z +1.02 at 78th pctl holds the DXY long; Other Reportables z +1.35 at 89th pctl; top-4 77.5% on a 6L/0S ledger; OptZ=+0.00 caveat |
| 11 | CHF | LEV CROWDED SHORT DEEPENED | +0.96 to +1.43 (Δ +0.47) | -1.32 to -1.54 (Δ -0.22) | dlr MODERATE LONG (held); lev MODERATE to ELEVATED SHORT | dealer 90.4th pctl, net +66,512 (genuine long franc); lev 6.7th pctl, net -14,964; small traders z -1.49 at 7th pctl; RV 1.13x (n=191); OptZ=+1.20, options-implied dealer delta stretched long; top-4 53.6% |
| 12 | Copper | COMMERCIALS RELEASED A TIER, MM STILL CROWDED | -1.78 to -1.21 (Δ +0.57) | +1.77 to +1.02 (Δ -0.75) | Commercials ELEVATED to MODERATE SHORT; Managed Money ELEVATED to MODERATE LONG | event z +1.67^, flow z +2.16, WoW +13,954; Commercials 10.6th pctl, net -97,911 hedge; Managed Money 80.8th pctl, net +65,541 long; Swap Dealers z -0.54; Other Reportables z +1.50 at 96th pctl |
| 13 | CAD | OUTSIZED FLOW, FOURTH STRAIGHT WEEKLY DECLINE | -0.50 to -0.92 (Δ -0.42) | +0.17 to +0.97 (Δ +0.80) | dlr now MODERATE SHORT (transition); lev NEUTRAL to MODERATE LONG | event z -2.09^, flow z -2.46, WoW -33,493; dealer 18.3rd pctl, net +48,614 (still a genuine long CAD); lev 78.8th pctl, net -39,022 short CAD; AM z +0.97 at 80th pctl; top-4 59.7%; OptZ=+0.42 |
| 14 | Bitcoin | LEV CROWDED LONG, DEALER STRUCTURAL LONG THINNING | -1.03 to -0.93 (Δ +0.10) | +1.32 to +1.61 (Δ +0.29) | dlr MODERATE SHORT (held); lev MODERATE to ELEVATED LONG | dealer 10.6th pctl, net +3,419 (structural long near its range low); lev 96.2nd pctl on a net of -6,354, below zero outright, thin 26L/42S # book; AM z -1.84 at 9th pctl; top-4 59.6%; OptZ=-0.22 |
| 15 | VIX | PROTECTION DEMAND LOW, AM VOL SELLING AT AN EXTREME | +0.56 to +0.91 (Δ +0.35) | +0.52 to +0.76 (Δ +0.24) | dlr MODERATE LONG (held); lev MODERATE LONG (held) | dealer 83.7th pctl, net +62,801 long VIX = low protection demand; AM net short vol at z -2.31, the board’s most negative AM reading; small traders net long VIX z +1.43 at 92nd pctl, a crowded protection bid; 29.3% of lev gross in spread structure; OptZ=+0.00 |
| 16 | S&P 500 (Consol) | REGIME RELEASE TO NEUTRAL | +0.58 to +0.40 (Δ -0.18) | -0.13 to +0.55 (Δ +0.68) | dlr MODERATE LONG to NEUTRAL; lev NEUTRAL to MODERATE LONG | dealer 57.7th pctl, net -681,795 (short in absolute terms), WoW -18,973, covering ~22,650/wk over 4 weeks; lev 69.2nd pctl on -311,831; AM z -0.46; OptZ=-1.68; E-Mini dlr +0.40 to +0.23 (Δ -0.17) |
| 17 | Ether | REGIME TRANSITION, INTRA-CRYPTO ROTATION | +0.26 to +0.53 (Δ +0.27) | +0.42 to +0.34 (Δ -0.08) | dlr NEUTRAL to MODERATE LONG; lev NEUTRAL (held) | dealer 70.2nd pctl, net +10,571 (structural long), WoW +1,168; lev 57.7th pctl on -7,722; AM z -1.42 at 12th pctl; top-4 75.2% on a thin 5L/10S book; OptZ=-0.53 |
| 18 | AUD | LEV CROWDED LONG STEPPED A TIER | -0.52 to -0.58 (Δ -0.06) | +1.26 to +1.58 (Δ +0.32) | dlr MODERATE SHORT (held); lev MODERATE to ELEVATED LONG | dealer 23.1st pctl, net -38,303 (short AUD); lev 95.2nd pctl, net +61,135 long AUD, adding ~2,134/wk; AM z -0.62; small traders 42.2% of OI, the largest small-trader share on the board; top-4 45.5% |
| 19 | Natural Gas | SWAP DEALER EXTREME, REST QUIET | +0.31 to +0.22 (Δ -0.09) | -0.85 to -0.89 (Δ -0.04) | Commercials NEUTRAL (held); Managed Money MODERATE SHORT (held) | Swap Dealers z +2.31 at 99th pctl on +223,515; Commercials 57.7th pctl, net -17,103; Managed Money net -100,024 short, aligned with the hedge; 49.6% of OI sits in the Managed Money book |
| 20 | EUR | LEV CROWDED SHORT (dollar-bull) | +0.68 to +0.70 (Δ +0.02) | -1.19 to -1.01 (Δ +0.18) | dlr MODERATE LONG (held); lev MODERATE SHORT (held) | dealer net -258,080 (short euro, high end of its short range, not a long), 72.1st pctl; lev 23.1st pctl short euro; AM +251,698 holds the euro long; small traders 20.5% of OI; OptZ=-0.13 |
| 21 | GBP | LEV CROSSED TO SHORT STERLING | +0.62 to +0.60 (Δ -0.02) | +0.04 to -1.12 (Δ -1.16) | dlr MODERATE LONG (held); lev NEUTRAL to MODERATE SHORT | dealer 68.3rd pctl, net +68,223 (genuine long GBP); lev 13.5th pctl, net +18,878 still long outright, reducing ~9,563/wk; AM z -0.52; small traders 35.6% of OI; OptZ=+0.54 |
| 22 | Gold | HEDGERS HIGH, SPECULATORS FLAT | +0.92 to +1.01 (Δ +0.09) | +0.03 to -0.01 (Δ -0.04) | Commercials MODERATE LONG (held); Managed Money NEUTRAL (held) | Commercials 73.1st pctl, net -26,250 hedge; Managed Money net +137,060 long at 58.7th pctl; Swap Dealers z -0.90 at 24th pctl; Other Reportables 39.4% of OI, the largest on the board |
| 23 | Silver | HEDGERS HIGH, MM SHORT OF ITS RANGE | +1.07 to +1.06 (Δ -0.01) | -0.81 to -0.93 (Δ -0.12) | Commercials MODERATE LONG (held); Managed Money MODERATE SHORT (held) | Commercials 76.0th pctl, net -17,407 hedge; Managed Money 26.9th pctl, net +12,632 still long outright; Swap Dealers z +0.96 at 83rd pctl; Other Reportables z -1.58 at 3rd pctl |
| 24 | WTI Crude | QUIET, HEDGERS NET LONG | +0.75 to +0.71 (Δ -0.04) | +0.41 to +0.32 (Δ -0.09) | Commercials MODERATE LONG (held); Managed Money NEUTRAL (held) | Commercials 78.8th pctl, net +307,409 (unusually net long for this cohort); Managed Money net +106,279 at 70.2nd pctl; Swap Dealers z -0.47; deep trader book (67L/60S); top-4 9.3%, the least concentrated on the board |
POSITIONING DYNAMICS
Rates (UST 2Y, UST 5Y, UST 10Y, UST 30Y, SOFR 3M)
Read this as one curve and the shape is unambiguous: dealers are carrying the board’s deepest short posture across the note complex while leveraged funds sit crowded at the top of their own range at three separate tenors. The 2Y is the week’s news, a two-tier step into extreme territory on the single largest repositioning of the week, and it arrived in the days before a Fed decision rather than after it. The 10Y is the standing level, deeper still and unchanged in character. The front-to-back gradient now has stress concentrated in duration rather than at the policy-sensitive front, which keeps the positioning stress concentrated in duration.
Three caveats carry over unchanged and none of them has softened. A large share of leveraged gross exposure in SOFR sits in spread and roll structures, so the directional read there overstates conviction. The options-implied dealer delta does not corroborate either the SOFR or the 2Y futures extreme, which makes both a basis or directional footprint rather than an options-hedging story; the 10Y is the sole exception, where the options book does support the read. And the measured realized-vol ratios across the complex are modest to flat, so the short-gamma vol amplification inference stays a hypothesis and nothing more.
The counterparty structure is worth stating plainly. In the 2Y, dealers and leveraged funds hold genuinely opposed postures versus their own ranges, and in SOFR they hold the only both-sides extreme on the board, which is maximum positioning tension in the structural sense. That is squeeze fuel if either side is forced to move, though it is market structure and not a directional call. Across the 5Y and 30Y, dealers and leveraged funds are drifting the same way rather than opposing each other, which compresses rather than builds that tension even as the leveraged level extends. Measured asset managers hold the mirror duration long in the 10Y near the top of their range and sit washed out at the bottom of theirs in the 2Y, 5Y and SOFR, and small traders are washed out across the note complex, the contrarian mirror of a crowded extreme. Positioning context only, not a forecast.
FX (USD Index, EUR, JPY, GBP, AUD, CAD, CHF, MXN)
The dollar book does not tell one clean story this week and that is itself the finding. Leveraged funds lean short the dollar against most crosses, holding the yen, the Aussie and the peso long while the euro and the franc are the two shorts, and they simultaneously released their small Dollar Index long to neutral. Asset managers hold the opposite index posture, long DXY near the top of their range while also holding the euro long outright. Cross-check that against the majors and the buy-side is genuinely split rather than expressing one coherent dollar view, which is worth a second look rather than a headline.
The yen produced the board’s most violent flow for the second consecutive week, and it reversed direction: last week the book reset one way, this week both cohorts crossed back the other. Dealers ended the week short yen while leveraged funds crossed into a crowded long. The peso remains the other aggressive book, with leveraged funds pressing their long a tier higher against a dealer short that has released two tiers of its own stretch, so the two sides are no longer opposed at the same intensity. The Canadian dollar carries outsized flow for a fourth straight week of dealer net decline, and mind the sign discipline there: the dealer regime reads short against its range while the outright position is still a genuine long, and leveraged funds hold the actual short. The franc is the FX book where the level and the counterparty structure line up best, dealers holding a real long high in their range against a leveraged short that deepened a tier, with the options-implied dealer delta stretched the same way. Sterling and the Australian dollar moved only on the leveraged side. In the euro, dealers read as a moderate long regime while remaining short the contract at the high end of their short range, so dealers and leveraged funds sit on the same side and the euro long belongs to asset managers.
The franc carries analog data. Five prior MODERATE LONG DELTA episodes returned a median -1.19% over the following four weeks, 1 of 4 with a resolved outcome bullish, against an unconditional base rate of +0.04% median and 51% bullish across all 885 weeks. That is a mild one-sided tilt on four resolved episodes, which is historical context and not a signal, and the window is anchored to Tuesday, so three sessions of any such window have already elapsed.
Equities (S&P 500, Nasdaq, Russell 2000)
The equity board rotated rather than stretched. Nasdaq is the transition: both cohorts crossed the neutral boundary in opposite directions in a single week, dealers into a moderate short and leveraged funds into a moderate long, on flow the tool flags as unusually large for the event phase. Neither side is stretched yet, and the leveraged fund position is still short in absolute contract terms, but the divergent trend is the configuration that builds a crowded trade if it extends. Note that Nasdaq Mini small traders sit near the high end of their own range, the classic crowded contrarian posture, context only. The S&P 500 did the opposite and released its dealer stretch back to the mean after four weeks of steady short covering, leaving a book where the flow was large and the level says nothing. Dealers remain net short the S&P 500 contract in absolute terms throughout, as they do in Nasdaq.
Russell 2000 stays the sharpest one-sided book on the equity board, though it eased. Dealers hold a genuine outright long high in their two-year range against a leveraged short that lifted one tier off extreme, and the dealer side carries the only equity concentration flag, meaning that book is thin if it has to turn. The counterparty tension is real but a tier less acute than last week, and the measured realized vol for that regime shows no amplification.
Russell carries analog data. Five prior MODERATE LONG DELTA episodes returned a median +5.83% over the four weeks that followed, 4 of 5 bullish, against an unconditional base rate of +1.09% median and 60% bullish across all 476 weeks. The median runs well above the base rate and the hit rate edges it, but on five overlapping episodes this is historical context, not a signal, and the same three-session elapse applies.
Crypto (Bitcoin, Ether)
The intra-crypto split widened. Bitcoin dealers sit low in their range on a structural long that keeps thinning, against leveraged funds crowded a tier higher near the top of theirs on a thin and concentration-flagged book, which is the cleanest crowded-long-versus-thinning-dealer configuration outside rates. Ether crossed the other way into a moderate dealer long. Standing caveat, unchanged: crypto dealers are structurally net long, so a negative z means the dealer long sits at the low end of its historical range rather than an outright short, and both books are thin enough that trader counts matter as much as the z. Measured asset managers are washed out in both names, more so in Bitcoin. The tool flags this as a crypto-specific divergence rather than a broad risk-off read, since equity positioning shows nothing comparable.
Commodities (Gold, Silver, WTI Crude, Copper, Natural Gas)
Copper is the only commodity that cleared the gate on its own terms. Commercials released a tier of their hedge stretch on flow the tool flags as outsized for the event phase, while Managed Money stepped down a tier but stayed crowded long against them. That is the canonical hedger-versus-speculator tension and it remains genuinely opposed, just less acute than last week. Other Reportables sit near the top of their range there too, an unusually large mid-size presence for this market. Positioning state only.
Natural gas carries one standing oddity, a Swap Dealer book pinned at the top of its range while Commercials sit mid-range and Managed Money runs short alongside the hedge. Gold, silver and WTI crude sat quiet: hedgers moderately high versus their own ranges in all three, speculators flat to modestly short, and no cohort near a boundary. Crude runs the least concentrated book on the board on a deep trader count, so its readings carry more participation weight than the others even when nothing moves.
COST BASIS LEVELS
| Market | Dealer Basis (Low-High) | Current Price | Dlr Gap | Lev Basis (Low-High) | Lev Gap |
|---|---|---|---|---|---|
| S&P 500 (Consol) | 6,644.84 – 6,845.78 | 7,714.50 | above zone | 7,095.91 – 7,315.31 | above zone |
| Nasdaq (Consol) | 28,986.82 – 29,977.37 | 29,922.75 | inside zone | 28,376.65 – 29,432.92 | above zone |
| Russell 2000 | 2,825.62 – 2,924.76 | 2,882.10 | inside zone | 2,854.08 – 2,951.17 | inside zone |
| VIX | 15.60 – 19.04 | 14.81 | below zone | 14.30 – 16.03 | inside zone |
| Bitcoin | 76,336.57 – 82,612.74 | 80,996.99 | inside zone | 72,561.09 – 78,932.08 | above zone |
| Ether | 2,272.71 – 2,514.97 | 2,631.50 | above zone | 2,207.51 – 2,426.08 | above zone |
| Gold | 4,168.40 – 4,382.55 | 4,415.30 | above zone | 3,972.55 – 4,185.25 | above zone |
| Silver | 57.62 – 63.75 | 66.86 | above zone | 65.01 – 72.12 | inside zone |
| Copper | 5.71 – 5.97 | 6.72 | above zone | 5.84 – 6.11 | above zone |
| WTI Crude | 77.61 – 91.70 | 95.66 | above zone | 80.91 – 93.37 | above zone |
| CHF | 1.23 – 1.25 | 1.23 | at the low edge | 1.24 – 1.26 | below zone |
Rates are excluded from cost basis by construction: structural shorts that never cross zero make the estimate unreliable. Three books trade inside their dealer zone this week (Nasdaq, Russell 2000, Bitcoin), meaning the aggregate epoch position there sits near flat P&L; VIX and the franc sit at or below theirs, and the commodity, large-cap equity and crypto books above. This is a descriptive P&L fact about the aggregate book. Tested in 2026, no covering response follows from a basis crossing, so do not treat any of these as triggers.
BOTTOM LINE
The decision this brief supports is sizing, not direction: the note complex now carries a dealer short extreme, a leveraged fund crowd at the top of its range across three tenors and the board’s only both-sides extreme, all of it measured before a Fed hike that has since landed and with PCE seven days out. Treat rate-book risk as structurally fragile rather than directionally informative, and read the yen and peso flows as the FX books most likely to move on size rather than view.
Data: CFTC COT Report 2026-09-15 | Prices as of 2026-09-18 | Analysis window: 104 weeks
Smart Money Pulse - '26 W37
The Bond Desks Dug In Six Days Before the Fed
The single most stretched position anywhere in this week’s report is in 10-Year Treasuries, where dealer desks pushed their short to the very bottom of its two-year range (z=-2.29) for a fourth straight week in the same direction. The big asset managers hold the other side of that trade near the top of their own range. Nobody is hedging this quietly; both sides keep adding.
For a normal portfolio that lands squarely on the bond sleeve. Intermediate and long-dated bond funds are where this book lives, and the professional money is arranged around the September 17 Federal Reserve rate decision rather than around anything that has already happened. August consumer inflation, released Wednesday, failed to cool, which is what turned a crowded rate position into a tense one.
Remember this is Tuesday’s snapshot and you are reading it on Friday. Since then the whole Treasury curve sold off with the longest maturities worst, small caps slid about two percent, the dollar firmed and crude oil pushed through $100. That is price action, not evidence that anyone moved their position; the next real look at positioning is next week’s report.
This Week’s Positioning
Copper: where commercial hedgers sit vs their 2-year range
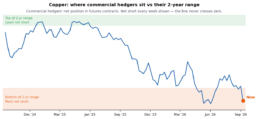
The producers and merchants who hedge physical copper stepped deeper into that hedge this week, down near the low end of their two-year range (z=-1.78), on one of the largest weekly shifts anywhere in the report. Managed Money, the speculative crowd, went the other way and now sits at the top of its own range, so the two groups are as far apart as this data gets. Copper trades around $6.55 after a strong run, and this arrangement describes who is holding what, nothing about where the price goes next.
Watch: whether copper holds above $6.50 through the Fed decision. Copper exposure shows up for most people inside a broad materials or commodity fund rather than through CPER directly.
Short-term rate futures: both sides pinned at the extremes
SOFR futures, the market’s bet on short-term interest rates, are the one contract where the dealers and the hedge fund crowd are both at historical extremes at the same time, in opposite corners. Read that as maximum tension into next week’s Fed meeting rather than as a view on rates, and discount it further: nearly two fifths of the speculative side is tied up in roll and calendar trades that carry no directional opinion at all.
Watch: the Fed statement on September 17. This is the book most directly exposed to a surprise in the language about the path of rates, and a regular investor feels it through short-dated bond funds like SHY and cash-like holdings.
The Japanese yen: the whole book got wiped clean
The yen saw the largest weekly repositioning of any market in the report, and it moved both professional groups at once: dealers crossed from a modest long into a net short yen position, while hedge funds abandoned a stretched short and went back to roughly flat. Both cohorts now lean the same way, mildly against the yen, which leaves this the least stale currency position on the board.
Watch: the dollar-yen rate into the Bank of Japan and Fed meetings. Japan is a top weight in almost every international index fund, so this one reaches a standard portfolio through the foreign sleeve.
Large-cap stocks: the two indexes stopped pulling apart
S&P 500 dealers moved up out of neutral into a mildly stretched posture on repositioning the tool flags as unusually large with no scheduled event behind it, while Nasdaq dealers came back down into neutral from the short side. The tech divergence that ran for several weeks has drained out of the futures book. The one exception is the Nasdaq options-implied reading, which is the most stretched figure on the board and sits far from where the futures say, so the tech story this week is an options-book fact rather than a positioning one.
Watch: how QQQ trades relative to SPY into the Fed decision. Small traders, the cohort your own account belongs to, are crowded near the high end of their range in Nasdaq, which is often where the crowd gets it wrong.
Everything else is holding a pose it has held for weeks. Small caps still carry the most one-sided speculative short in the report against an outright dealer long, unchanged from last week and now background rather than news. The dollar index stays pinned with dealers stretched short against a fast-money long, a consistently dollar-bullish lean that also shows up as a crowded short in the euro, and the Mexican peso holds the same maximum-tension setup. Institutional appetite for volatility protection faded again, with the big asset managers showing little interest in owning it while small traders sit near the top of their own range holding protection. In Bitcoin, the structural dealer long keeps sitting at the floor of its two-year range while the hedge fund crowd stays near the top of its own. The British pound, Swiss franc, Canadian dollar and Australian dollar all shuffled without reaching a stretch, and gold, silver, crude and natural gas show the usual hedger-versus-speculator gap with nothing at a genuine extreme.
Know Where You Stand
- Protection is unusually cheap right now, and that is a fact about pricing, not a recommendation to buy it. The fear gauge sits near 15.9 with institutions net short volatility, so if a hedge on an SPY position was ever part of your plan, this is the part of the cycle where it costs least; if hedging is not part of your plan, the useful version of this is simply knowing you are unhedged going into September 17.
- Your foreign holdings carry a dollar bet you did not choose. The professional money is leaning dollar-bullish through several currencies at once, and a stronger dollar quietly drags on unhedged international funds like VXUS and on commodity exposure; worth checking whether your foreign sleeve is currency-hedged, because most default options are not.
- Check whether tech has crept up as a share of your account. Small traders are crowded at the high end of their range in Nasdaq futures, and the same drift happens passively in retirement accounts when a few large names run; pull up your actual QQQ or total-market weighting rather than assuming last year’s allocation still holds.
Data: CFTC COT Report 2026-09-08 | Prices as of 2026-09-11 | 104-week lookback
Liquidity Trajectory '26 W37
LIQUIDITY TRAJECTORY
CFTC Report Date: 2026-09-08 | Generated: 2026-09-11 15:50 ET
EXECUTIVE SUMMARY
- Duration is the board’s stress center and it deepened. UST 10Y dealers pushed further into EXTREME SHORT (z -2.03 to -2.29), the 0.0th percentile of the two-year range, on a fourth straight week of net decline (WoW -47,349, net -634,446). This is the one dealer extreme on the board carrying options corroboration rather than a caveat (OptZ=-1.07), so the options-book read has support this week. Measured realized vol in this regime runs 1.00x the all-week average (n=57 overlapping weeks), so no vol amplification is evident in this market’s history. Measured asset managers hold the other side at the 94th percentile (AM z +1.65).
- SOFR 3M remains the board’s only both-sides extreme and both sides widened. Dealers sit at the 99.0th percentile on an outright +3,693,025 contract long (WoW +313,707, flow z +1.59^) against leveraged funds at the 1.9th percentile, whose regime slipped a tier from ELEVATED to EXTREME SHORT (z -1.97 to -2.16). Measured asset managers are washed out at the 0th percentile (AM z -2.23), 39% of leveraged gross exposure is spread structure, and the options-implied dealer delta carries a caveat (OptZ=-1.77), so read the futures extreme as a basis or directional footprint, not gamma.
- Copper produced the week’s cleanest commodity development: a regime step to ELEVATED SHORT for Commercials (z -1.23 to -1.78, 1.9th percentile) on the third-largest relative flow on the board (flow z -2.29^), against Managed Money stepping up to ELEVATED LONG (z +1.41 to +1.77). That is a full opposed-extremes book with a concentration flag (28L/35S #), and it is positioning state only.
- The yen book reset both cohorts on the board’s largest flow (flow z -6.88^, WoW -118,798). Dealers crossed the zero line into net short yen (-39,477) and leveraged funds released an ELEVATED SHORT back to NEUTRAL (z -1.73 to -0.29). Elsewhere in FX the dollar story held its shape: USD Index dealers stayed ELEVATED SHORT (z -1.90, 5.8th percentile) on a one-sided, concentration-flagged ledger (top-4 64.7%, 7L/0S #) with measured realized vol at 1.18x the all-week average (n=35), the highest measured realized-vol ratio on the board, and the buy-side long DXY.
- Catalyst line: August CPI printed Wednesday Sep 9 and inflation failed to cool, and the FOMC decision lands Sep 17, six days out, directly on the SOFR, 2Y and 5Y books that already carry the board’s crowding. PCE follows Sep 25, fourteen days out, on the same front-end complex. NFP sits outside the two-week window on Oct 2.
SINCE THE SNAPSHOT
This brief reflects positioning as of the 2026-09-08 Tuesday snapshot; the price moves below are current through Friday September 11 and run on a different clock. Price action does not confirm any repositioning.
| Market | Since Tue | Level/Note |
|---|---|---|
| S&P 500 | -0.18% | ES=F ~7,667 |
| Nasdaq | -0.41% | NQ=F ~29,419 |
| Russell 2000 | -1.91% | RTY=F ~2,907, the weakest major |
| VIX | +0.83% | ^VIX 15.85 |
| Bitcoin | -1.52% | ~77,235 |
| Ether | +2.21% | ~2,540 |
| UST 10Y | -1.31% | ZN=F futures down = yields up |
| UST 2Y | -0.58% | ZT=F futures down = front-end yields up |
| UST 30Y | -1.95% | ZB=F futures down = long-end yields up |
| Dollar Index | +0.29% | DX-Y.NYB 99.12, USD up |
| JPY | +0.65% | 6J=F up = yen up vs dollar |
| CAD | -0.23% | 6C=F down = Canadian dollar down vs USD |
| Copper | -2.86% | HG=F 6.55 |
| WTI Crude | +8.10% | CL=F 100.57 |
August CPI was released Wednesday and inflation did not cool, and the tape since the snapshot has traded a rate-hike repricing on top of an oil spike: the whole curve sold off with the long end worst, small caps slumped hardest of the majors, the dollar firmed and crude ran through 100. All of this is price action after the Tuesday snapshot; none of it confirms dealer, leveraged fund, asset manager, Commercial or Managed Money repositioning. The next positioning data is not visible until next week’s report.
POSITIONING TABLE
| Rank | Market | Signal | Dlr Z (prior to cur, Δ) | Lev Z (prior to cur, Δ) | Regime (+ transition) | Key Detail |
|---|---|---|---|---|---|---|
| 1 | UST 10Y | DEALER EXTREME SHORT, DEEPENED | -2.03 to -2.29 (Δ -0.26) | -0.26 to +0.17 (Δ +0.43) | dlr EXTREME SHORT (held, deeper); lev NEUTRAL (held) | dealer 0.0th pctl, net -634,446, WoW -47,349; 4 straight weeks of dealer net decline (avg -40,045/wk); AM long 94th pctl (z +1.65); RV 1.00x (n=57), no amplification; OptZ=-1.07 corroborates; small traders washed out (z -1.68) |
| 2 | SOFR 3M | OPPOSED EXTREMES, BOTH WIDER | +2.43 to +2.64 (Δ +0.21) | -1.97 to -2.16 (Δ -0.19) | dlr EXTREME LONG (held); lev ELEVATED to EXTREME SHORT | flow z +1.59^, WoW +313,707; dealer 99.0th pctl, net +3,693,025; lev 1.9th pctl, net -2,803,445; AM z -2.23 at 0th pctl; 39% lev gross in spread structure; OptZ=-1.77 caveat; 93L/89S # |
| 3 | UST 2Y | LEV EXTREME LONG, REAL MONEY WASHED OUT | -1.11 to -1.19 (Δ -0.08) | +2.66 to +2.48 (Δ -0.18) | dlr MODERATE SHORT (held); lev EXTREME LONG (held) | lev 96.2nd pctl but still net short in absolute terms (-1,290,479), unwinding ~17,771/wk; dealer 13.5th pctl, net -443,848; AM z -2.18 at 3rd pctl; small traders z -1.76, washed out; OptZ=+0.54 |
| 4 | Copper | REGIME STEP + OPPOSED EXTREMES # | -1.23 to -1.78 (Δ -0.55) | +1.41 to +1.77 (Δ +0.36) | Commercials MODERATE to ELEVATED SHORT; Managed Money MODERATE to ELEVATED LONG | flow z -2.29^, WoW -14,843; Commercials 1.9th pctl, net -111,865 hedge; Managed Money 99.0th pctl, net +82,154; Swap Dealers z -1.36; Other Reportables z +1.63 at 98th pctl; 28L/35S # |
| 5 | Russell 2000 | LEV EXTREME SHORT vs OUTRIGHT DEALER LONG # | +1.39 to +1.26 (Δ -0.13) | -2.07 to -2.03 (Δ +0.04) | dlr MODERATE LONG (held); lev EXTREME SHORT (held) | dealer 95.2nd pctl, outright long +89,619, top-4 21%, 26L/22S #; lev 1.9th pctl, net -110,147, still reducing ~4,288/wk; AM z -0.45; RV 0.93x (n=101); OptZ=-0.39 |
| 6 | UST 5Y | LEV CROWDED LONG, BOTH SIDES STRETCHING | -1.12 to -1.47 (Δ -0.35) | +1.74 to +1.98 (Δ +0.24) | dlr MODERATE SHORT (held); lev ELEVATED LONG (held) | dealer 4.8th pctl, net -855,908, WoW -41,473; lev 99.0th pctl, still net short in absolute terms (-2,066,289), adding ~21,970/wk; AM z -1.07; RV 1.11x (n=244); OptZ=-0.50 |
| 7 | USD Index | DEALER STRETCHED SHORT + CONCENTRATION # | -1.92 to -1.90 (Δ +0.02) | +1.10 to +1.07 (Δ -0.03) | dlr ELEVATED SHORT (held); lev MODERATE LONG (held) | dealer 5.8th pctl, net -26,846; buy-side long DXY (lev +6,186, AM z +1.10) = bullish USD; MEASURED VOL 1.18x (n=35); OptZ=+0.00 caveat; top-4 64.7%, 7L/0S # |
| 8 | MXN | OPPOSED EXTREMES | -1.81 to -1.85 (Δ -0.04) | +1.64 to +1.86 (Δ +0.22) | dlr ELEVATED SHORT (held); lev ELEVATED LONG (held) | dealer 3.8th pctl, net -128,427 (short peso); lev 99.0th pctl, net +82,101 long peso, adding ~5,577/wk; AM z +0.99; RV 0.97x (n=37), no amplification; OptZ=+0.60 caveat; 4 straight weeks of dealer net decline |
| 9 | JPY | BOARD-LARGEST FLOW, BOTH COHORTS RESET | +1.33 to +0.20 (Δ -1.13) | -1.73 to -0.29 (Δ +1.44) | dlr MODERATE LONG to NEUTRAL; lev ELEVATED SHORT to NEUTRAL | flow z -6.88^, WoW -118,798, the largest relative flow on the board; dealer net crossed zero to -39,477 (short yen), having been above zero a week ago; lev net -49,098; AM z -0.51; Other Reportables 18.5% of OI; OptZ=-0.83 |
| 10 | S&P 500 (Consol) | REGIME TRANSITION ON OUTSIZED FLOW | +0.23 to +0.58 (Δ +0.35) | +0.23 to -0.13 (Δ -0.36) | dlr NEUTRAL to MODERATE LONG; lev NEUTRAL (held) | flow z +1.62^, WoW +38,411 without a calendar catalyst; dealer 69.2nd pctl, net -662,822 (short in absolute terms, at the high end of its short range); AM +914,443 long; OptZ=-0.33; E-Mini dlr +0.08 to +0.40 (Δ +0.32), lev +0.45 to +0.14 (Δ -0.31) |
| 11 | Nasdaq (Consol) | REGIME TRANSITION BACK TO NEUTRAL | -0.61 to -0.21 (Δ +0.40) | +0.82 to +0.04 (Δ -0.78) | dlr MODERATE SHORT to NEUTRAL; lev MODERATE LONG to NEUTRAL | flow z +1.79^, WoW +12,113; dealer 51.0th pctl, net -57,602; OptZ=-2.39, the board’s most stretched options-implied dealer delta; AM z +0.57; Mini dlr -0.80 to -0.39 (Δ +0.41), small traders z +1.50 at 95th pctl |
| 12 | CAD | REGIME TRANSITION ON OUTSIZED FLOW | -0.05 to -0.50 (Δ -0.45) | -0.49 to +0.17 (Δ +0.66) | dlr NEUTRAL to MODERATE SHORT; lev NEUTRAL (held) | flow z -2.64^, WoW -35,852; dealer 30.8th pctl, net +82,107 (long CAD, at the low end of its range); lev net -55,448 short CAD; AM z +0.64; top-4 58.6%; 4 straight weeks of dealer net decline |
| 13 | VIX | REGIME TRANSITION, PROTECTION DEMAND EASING | +0.41 to +0.56 (Δ +0.15) | +0.42 to +0.52 (Δ +0.10) | dlr NEUTRAL to MODERATE LONG; lev NEUTRAL to MODERATE LONG | dealer 69.2nd pctl, net +52,894 long VIX = low protection demand; AM net short vol (z -1.68) confirms the complacent read; small traders net long VIX z +1.47 at 93rd pctl, a crowded protection bid; 26% of lev gross in spread structure; OptZ=+0.00 |
| 14 | UST 30Y | LEV LONG-END LEAN, BOTH COVERING | -1.00 to -0.87 (Δ +0.13) | +1.13 to +1.37 (Δ +0.24) | dlr MODERATE SHORT (held); lev MODERATE LONG (held) | dealer 20.2nd pctl, net -251,880; lev 94.2nd pctl, still net short in absolute terms (-276,965), adding ~25,320/wk; AM z +0.26; Other Reportables z -2.32 at 1st pctl; top-4 34.8%; OptZ=+0.50 |
| 15 | Bitcoin | LEV CROWDED LONG, DEALER LONG AT RANGE LOW | -1.03 to -1.03 (Δ 0.00) | +1.41 to +1.32 (Δ -0.09) | dlr MODERATE SHORT (held); lev MODERATE LONG (held) | dealer 4.8th pctl, net +2,943 (structural long at its range low); lev 87.5th pctl on a net of -7,892, below zero in absolute terms; AM z -1.45; RV 0.91x (n=33); top-4 60.9% on a thin 10L/11S book |
| 16 | GBP | REGIME TRANSITION, LEV BACK TO FLAT | +0.48 to +0.62 (Δ +0.14) | +0.65 to +0.04 (Δ -0.61) | dlr NEUTRAL to MODERATE LONG; lev MODERATE LONG to NEUTRAL | dealer 69.2nd pctl, net +68,548 (long GBP); lev net +34,627, unwinding ~2,949/wk; AM -105,864 short GBP (z -0.91); top-4 43.4%; OptZ=-1.30 |
| 17 | EUR | LEV CROWDED SHORT (dollar-bull) | +0.64 to +0.68 (Δ +0.04) | -1.38 to -1.19 (Δ +0.19) | dlr MODERATE LONG (held); lev MODERATE SHORT (held) | dealer net -261,454 (short euro, at the high end of its short range, not a long); lev 18.3rd pctl also short euro (-33,285), so both sit the same side; AM +250,678 holds the euro long; OptZ=-1.43 |
| 18 | CHF | LEV CROWDED SHORT DEEPENED | +0.54 to +0.96 (Δ +0.42) | -0.81 to -1.32 (Δ -0.51) | dlr MODERATE LONG (held); lev MODERATE SHORT (held) | dealer 79.8th pctl, net +60,845 (long CHF), 9L/0S; lev 12.5th pctl, net -13,440; AM z +0.13; dealers hold 65.9% of gross-long OI here; OptZ=+0.50 |
| 19 | Silver | COMMERCIALS HIGH, MM SHORT | +1.19 to +1.07 (Δ -0.12) | -1.00 to -0.81 (Δ +0.19) | Commercials MODERATE LONG (held); Managed Money MODERATE SHORT (held) | Commercials 76.0th pctl, net -17,517 hedge; Managed Money 32.7th pctl, net +14,386 long; Swap Dealers z +0.65; small traders 25.4% of OI, the board’s largest retail footprint |
| 20 | Gold | QUIET, HEDGERS MID-RANGE | +0.90 to +0.92 (Δ +0.02) | +0.05 to +0.03 (Δ -0.02) | Commercials MODERATE LONG (held); Managed Money NEUTRAL (held) | Commercials 72.1st pctl, net -28,275 hedge; Managed Money net +139,548 long at 60.6th pctl; Swap Dealers z -1.17; Other Reportables 39.3% of OI; OI WoW +167,468, a large open-interest build |
| 21 | WTI Crude | QUIET, HEDGERS NET LONG | +0.77 to +0.75 (Δ -0.02) | +0.11 to +0.41 (Δ +0.30) | Commercials MODERATE LONG (held); Managed Money NEUTRAL (held) | Commercials 79.8th pctl, net +308,916 (unusually net long for this cohort); Managed Money net +111,731, adding ~8,302/wk; Swap Dealers z -0.52; deepest commodity trader book on the board (61L/55S) |
| 22 | AUD | LEV CROWDED LONG, BOTH ADDING | -0.68 to -0.52 (Δ +0.16) | +1.29 to +1.26 (Δ -0.03) | dlr MODERATE SHORT (held); lev MODERATE LONG (held) | dealer 26.0th pctl, net -33,579 (short AUD); lev 86.5th pctl, net +49,779 long AUD; AM z -0.42; top-4 55.5%; OptZ=+0.16 |
| 23 | Natural Gas | SWAP DEALER EXTREME, REST QUIET | +0.25 to +0.31 (Δ +0.06) | -0.73 to -0.85 (Δ -0.12) | Commercials NEUTRAL (held); Managed Money MODERATE SHORT (held) | Swap Dealers z +2.17 at 99th pctl, net +216,391; Commercials 63.5th pctl, net -15,265; Managed Money net -96,742 short, aligned with the hedge; Other Reportables z -0.80 |
| 24 | Ether | QUIET, FLOW WITHOUT LEVEL | -0.22 to +0.26 (Δ +0.48) | +0.81 to +0.42 (Δ -0.39) | dlr NEUTRAL (held); lev MODERATE LONG to NEUTRAL | flow z +1.74^, WoW +2,045 on a neutral base; dealer 60.6th pctl, net +9,403 (structural long); AM z -1.33; top-4 80.0% on a thin 4L/10S book, the board’s most concentrated; OptZ=-0.54 |
POSITIONING DYNAMICS
Rates (UST 2Y, UST 5Y, UST 10Y, UST 30Y, SOFR 3M)
The curve is the only place on the board where both sides of the book are stretched at once, and this week the stress migrated outward rather than releasing. The front end is where the crowding lives: leveraged funds hold the top of their own range across 2Y, 5Y and 30Y while dealers sit below theirs, and the SOFR contract carries both cohorts at outright extremes simultaneously. Read that as maximum counterparty tension into the Fed rather than as conviction about the level of rates; in every one of those books the leveraged position is still net short in absolute terms, so a “crowded long” here means crowded relative to their own history, not an outright bullish duration bet.
Two caveats travel with the rates complex unchanged from last week and they still bind. First, the leveraged spread share in SOFR is large enough that the directional read overstates conviction; the same basis and calendar-spread flow that produces a dealer footprint at the extremes produces no directional view at all. Second, the options-implied dealer delta in SOFR is not stretched, so the futures extreme there reads as a basis or directional footprint and the options-hedging hypothesis has no support. The 10Y is the exception on both counts: its options-implied delta is stretched the same way the futures book is, which is the only place this week where the gamma hypothesis has corroboration rather than a caveat, and even there the measured realized-vol ratio shows no amplification. The 5Y is the tenor to watch for the standoff resolving, because dealers and leveraged funds are both extending in the same direction there, which compresses the counterparty tension that normally drives sharp unwinds.
FX (USD Index, EUR, JPY, GBP, AUD, CAD, CHF, MXN)
The dollar story is coherent and it has not changed shape. The buy-side holds the Dollar Index long while running short the euro through the leveraged book, and dealers absorb the other side at a stretched short in DXY; those three facts tell one consistent bullish-dollar positioning story rather than three separate ones. The Dollar Index is also the board’s highest measured realized-vol ratio, and the ledger behind it is thin and one-sided enough that the concentration flag matters more than the z-score: a handful of traders carry the dominant side. Prior ELEVATED SHORT episodes in the Dollar Index ran a median 4-week return of -0.3% with 0 of 5 bullish, against an unconditional baseline of +0.1% median and 52% bullish across all weeks (n=885). Five episodes is not a sample to lean on; treat the skew as historical context, not a forecast.
The yen was the week’s real FX event. The repositioning was the largest relative flow anywhere on the board and it moved both cohorts at once: dealers crossed the zero line and leveraged funds abandoned an elevated short back to flat. That is a structural reset of the book rather than a directional statement, and with the Bank of Japan on the calendar chatter alongside the Fed, it leaves the yen with the least stale positioning of any major. The Canadian dollar produced a smaller version of the same thing, a regime crossing on outsized flow into a fourth straight week of dealer net decline. The peso stays the second opposed-extremes book, with leveraged funds actively extending a crowded long against a dealer short that keeps eroding, and its prior episodes carry a mild positive skew versus baseline that the sample size does not support leaning on. Sterling and the franc both cleared the gate on cohort crossings without level: leveraged funds released a long in sterling and deepened a short in the franc, neither from a stretched base. The Australian dollar sits quiet with both cohorts leaning the same way.
Equities (S&P 500, Nasdaq, Russell 2000)
Equity positioning normalized in both directions this week. S&P dealers crossed up out of neutral on outsized flow with no calendar catalyst behind it, while Nasdaq dealers crossed back down into neutral from the short side; the two indices are now moving toward each other rather than apart, which drains the sector-rotation divergence that has been the equity read for several weeks. The one figure that still separates them is the Nasdaq options-implied dealer delta, which is the most stretched on the board and sits well short of where the futures book reads, so the tech extreme this week is an options-book fact rather than a futures-positioning fact.
The Russell remains the group’s genuine tension and it is the standing story rather than the new one. Leveraged funds hold an extreme short against an outright dealer long that carries the equity complex’s concentration flag, and they are still reducing into it, which is the textbook squeeze-fuel configuration: a crowded short that is being extended has more to unwind if a catalyst forces it. Prior MODERATE LONG DELTA episodes in the Russell returned a median +5.8% over 4 weeks with 4 of 5 bullish, against an unconditional baseline of +1.1% median and 60% bullish (n=475). That is a deviation worth noting, but five episodes is context, not a signal, and the forward window is anchored to Tuesday, so three sessions of it have already elapsed. Small traders sit at a crowded extreme in the Nasdaq book, the classic contrarian-watched posture, and that is convention rather than a forecast.
Commodities (Gold, Silver, WTI Crude, Copper, Natural Gas)
Copper is the only commodity that cleared the gate and it cleared it on all three counts: a regime step, the group’s largest flow, and a full opposed-extremes configuration with Commercials stepping deeper into their hedge while Managed Money extends a speculative long, on a concentrated book. The Commercials-versus-Managed-Money gap is the canonical hedger-versus-speculator read here, and describing the tension is where it ends. There is no measured forward-return edge in this market; prior ELEVATED SHORT episodes for Commercials ran a median 4-week return of -1.4% with 2 of 5 bullish against an unconditional baseline of +0.8% median and 55% bullish (n=885), which is well inside noise for a five-episode sample. Other Reportables also sit near the top of their range in copper, so the long side of the hedge is spread across more than just the speculative crowd.
The rest of the complex sat quiet. Gold and silver hedgers hold the same mid-to-high posture as last week with the speculative crowd flat to slightly short, crude’s Commercials remain unusually net long for that cohort with the deepest trader participation on the board, and natural gas is a Swap Dealer story rather than a hedger-versus-speculator one, with Commercials and Managed Money leaning the same way.
Crypto (Bitcoin, Ether)
The intra-crypto split widened and it is a divergence in posture, not in direction. Ether dealers crossed back toward the middle of their range while Bitcoin dealers held at the bottom of theirs, so the structural dealer long in Bitcoin sits at the low end of its two-year range while Ether’s sits comfortably mid-range. That is the rotation the board has been signaling for two weeks, and the standing caveat still applies unchanged: crypto dealers are structurally net long, so a negative z-score here is a compressed long, never a literal short. Leveraged funds run the counterparty side in both, crowded long in Bitcoin relative to their own range while still net short in absolute terms, which is the same arithmetic trap as the rates book. Ether’s flow cleared the notable threshold on a neutral base, so it stays a table row rather than a story, and both books are thin enough at the top that the concentration numbers deserve more weight than the z-scores. Bitcoin’s prior MODERATE SHORT DELTA episodes returned a median +8.5% over 4 weeks with 3 of 5 bullish against an unconditional baseline of +2.1% median and 57% bullish (n=622); with five episodes and a wide dispersion that is context, not conviction. Bitcoin positioning stress is also decoupled from the equity complex this week, so do not read it as part of a broad risk-off.
COST BASIS LEVELS
| Market | Dealer Basis (Low-High) | Current Price | Dlr Gap | Lev Basis (Low-High) | Lev Gap |
|---|---|---|---|---|---|
| S&P 500 (Consol) | 6,620.09 – 6,820.20 | 7,666.75 | above zone | 7,095.91 – 7,315.31 | above zone |
| Nasdaq (Consol) | 29,034.65 – 29,979.65 | 29,417.75 | inside zone | 28,376.65 – 29,432.92 | inside zone |
| Russell 2000 | 2,825.62 – 2,924.76 | 2,907.20 | inside zone | 2,854.08 – 2,951.17 | inside zone |
| VIX | 15.72 – 19.06 | 15.85 | inside zone | 14.30 – 16.03 | inside zone |
| USD Index | 99.49 – 100.94 | 99.12 | below zone | 99.13 – 99.93 | below zone |
| Bitcoin | 76,578.33 – 83,105.04 | 77,234.54 | inside zone | 72,571.70 – 78,932.08 | inside zone |
| Ether | 2,262.12 – 2,494.07 | 2,539.41 | above zone | 2,198.50 – 2,406.76 | above zone |
| Gold | 4,148.79 – 4,331.37 | 4,389.50 | above zone | 3,968.76 – 4,150.55 | above zone |
| Silver | 57.63 – 63.75 | 64.90 | above zone | 65.02 – 72.12 | below zone |
| WTI Crude | 77.61 – 91.70 | 100.57 | above zone | 80.91 – 93.37 | above zone |
| Copper | 5.71 – 5.97 | 6.55 | above zone | 5.84 – 6.11 | above zone |
| Natural Gas | 2.84 – 3.10 | 2.83 | below zone | 2.78 – 3.01 | inside zone |
Rates are excluded from cost basis by construction: structural shorts that never cross zero make the estimate unreliable. Four books trade inside their dealer zone this week (Nasdaq, Russell, VIX, Bitcoin), meaning the aggregate epoch position sits near flat P&L; the Dollar Index and natural gas trade below both zones and the commodity and large-cap equity books trade above. This is a descriptive P&L fact about the aggregate book. Tested in 2026, no covering response follows from a basis crossing, so do not treat any of these as triggers.
BOTTOM LINE
The risk into the Fed is concentrated in the front end, not in equities: size positions against a rates complex where leveraged funds and dealers are simultaneously at the top and bottom of their own ranges, and discount the crowding half of that read by the spread-structure share and the options caveat before acting on it. Everything else on the board, equities included, is normalizing toward the middle.
Data: CFTC COT Report 2026-09-08 | Prices as of 2026-09-11 | Analysis window: 104 weeks
Smart Money Pulse - '26 W36
The Most Lopsided Bet on the Board Is Now in Small Caps
For much of the past month the crowded corners of this data sat in bonds and the dollar. The sharpest one-sided book in the report now sits in small caps, where the professional desks hold a genuine outright long near the very top of their two-year range while the hedge fund crowd has pressed a short to the bottom of its own, the most lopsided speculative position on the board.
That matters more to an ordinary portfolio than it sounds. Small caps are the sleeve most people own without thinking about it, through IWM or the small-company slice inside a total-market index fund, and this is the one equity book where a handful of large desks control most of the dominant side. A thin, one-sided book is a condition, not a forecast. It says nothing about which way things go and quite a lot about how fast the market could move if something knocks it.
The calendar is dense from here. August payrolls landed Friday morning at 162,000 jobs, more than double what economists expected; CPI, the monthly consumer inflation reading, follows on September 9, and the Federal Reserve’s rate decision comes September 17. Keep in mind this is Tuesday’s picture. Small caps have already climbed since then and the fear gauge slid toward the mid-14s, but none of that turns up in the positioning data until next week’s report.
This Week's Positioning
Small caps: the two big cohorts are as far apart as the data goes
Dealers hold an outright net long in Russell 2000 futures sitting at the 98th percentile of its two-year range, and the hedge fund crowd answered by driving its short to the extreme low end of its own (z=-2.07). The dealer side carries the only equity concentration flag on the board, meaning a small number of desks own most of that position, so there is not much depth behind it if either side has to move.
Watch: how IWM trades around the September 9 inflation print. That is the first real test of a book with almost nobody sitting on the other side.
Treasuries: the bet that defined last week already came apart
The 5-Year Treasury short that was the single deepest position anywhere on the board a week ago snapped back two full steps, on the largest weekly repositioning in the rate complex, while the 10-Year went the opposite direction and is now the most stretched dealer short in the report (z=-2.03, the very bottom of its two-year range). The professional desks also hold an enormous outright long in SOFR futures, the market’s bet on short-term interest rates, near the high end of its range, with hedge funds jammed into the opposite corner.
Watch: whether longer-dated bond funds like TLT start behaving differently from short-dated ones like SHY through the September 17 Fed decision. The positioning stress has migrated from the middle of the curve out to the long maturities.
Nasdaq: the pros and the fast money traded places
Dealers crossed out of neutral and into a moderate short in a single week (z=-0.61) while the hedge fund crowd moved the other way, up to the high end of its own range (z=+0.82), on repositioning the tool flags as unusually large with no scheduled event behind it. Neither side is stretched yet, but two cohorts crossing in opposite directions inside one week is how a crowded trade starts to build.
Watch: QQQ into the September 9 inflation reading. If the two sides keep separating, this becomes next month’s crowded book rather than this month’s footnote.
The Japanese yen: the speculative short got deeper
Hedge funds pushed their yen short down to the low end of its two-year range (z=-1.73), while dealers went the other way and now hold a genuine net long in the yen, one of the biggest weekly shifts in the entire currency book. Since Tuesday’s snapshot the yen has strengthened against the dollar, which is price action and not evidence that anybody has covered anything.
Watch: the dollar-yen exchange rate. A continued yen rally leans on one of the more one-sided currency positions in this report, and Japan-heavy international funds are where a regular investor feels it.
Everything else is either standing still or standing pat. The dollar index is still the report’s most durable stretch, with dealers pinned short against a fast-money long, but it barely moved a contract this week, and the Mexican peso holds the same maximum-tension setup it has carried for weeks. Dealer positioning in the fear gauge eased back to neutral and the big asset managers showed little appetite for protection, though small traders, the crowd your own account belongs to, are the ones buying protection near the top of their range, and that is often where the crowd gets it wrong. Bitcoin’s professional long keeps thinning toward the floor of its range while hedge funds sit near the top of theirs, the euro, British pound, Canadian dollar and Australian dollar all sat quiet, the Swiss franc drifted into a mild dealer long, and gold, silver, copper, crude and natural gas show the usual gap between hedgers and speculators with nothing at a genuine extreme.
Know Where You Stand
- Find out how much small-cap exposure you are actually carrying. Plenty of people hold more than they realize through a total-market fund or a target-date fund’s equity sleeve rather than through IWM directly, and this is the week the data says that slice sits on the thinnest, most one-sided book in the report; the point is to size it deliberately, not to trade it.
- Your bond holdings are not one thing, and the pressure just moved along the curve. Short-dated funds like SHY and long-dated ones like TLT are answering to different crowds right now, and a broad fund like BND blends both, so if you own bonds through a single ticker it is worth knowing which end of the maturity range you are really exposed to before September 17.
- Two dates own the next two weeks, so set a rebalance date rather than reacting to each print. CPI on September 9 and the Fed decision on September 17 both land on the same crowded rate and currency books, and a 60/40 or target-date investor is exposed to them through the stock sleeve and the bond sleeve at once; picking a single date after the 17th to review your allocation beats making two separate decisions under a headline.
Data: CFTC COT Report 2026-09-01 | Prices as of 2026-09-04 | 104-week lookback
Liquidity Trajectory '26 W36
LIQUIDITY TRAJECTORY
CFTC Report Date: 2026-09-01 | Generated: 2026-09-04 16:00 ET
EXECUTIVE SUMMARY
- The rates curve stayed the board’s stress center, but the pressure moved. The UST 5Y released two tiers, dealers from EXTREME SHORT to MODERATE SHORT (z -2.19 to -1.12) on the largest rate-book repositioning of the week (flow z +2.65^, WoW +114,590 contracts), while the 10Y held its EXTREME SHORT at the 0.0th percentile (z -2.03). Measured asset managers sit long the 10Y at the 98th percentile (AM z +1.82). Measured realized vol in the 10Y’s regime runs 1.03x the all-week average (n=57), so the short-gamma amplification story is not evident in this market’s history.
- SOFR 3M remains the single OPPOSED EXTREMES book at the policy-sensitive front end. Dealers hold an outright +3,379,318 contract long at the 98.1st percentile against a leveraged fund short at the 4.8th percentile, with measured asset managers washed out at the 0th percentile (AM z -2.05). The lev regime eased a tier (z -2.00 to -1.97), 39% of lev gross exposure there is spread structure, and the options-implied dealer delta carries a caveat (OptZ=-2.18), so read the futures extreme as a basis or directional footprint, not gamma.
- Equity positioning re-stretched in the small caps and rolled over in tech. Russell 2000 leveraged funds pushed from ELEVATED to EXTREME SHORT (z -2.07, 1.9th percentile) against an outright dealer long of +96,593 contracts at the 98.1st percentile carrying the board’s equity concentration flag (30L/20S #). Nasdaq dealers crossed from NEUTRAL into MODERATE SHORT on outsized flow (Consol flow z -2.20^) while leveraged funds crossed the other way. Group equity dealer average is +0.34z.
- The dollar book held its stretch, the peso kept maximum tension, and yen speculative shorts deepened. USD Index dealers stayed ELEVATED SHORT (z -1.92, 4.8th percentile) on a heavily concentrated ledger (7L/0S #) with measured realized vol at 1.19x the all-week average (n=34), the one amplified-vol reading on the board. MXN is the second OPPOSED EXTREMES book (dealer z -1.81 against lev z +1.64), and JPY leveraged funds moved from MODERATE to ELEVATED SHORT (z -1.73, 1st percentile) on unusually large dealer flow (flow z +2.10^). VIX and Ether both transitioned to NEUTRAL dealer regimes, Ether on the board’s largest relative flow (flow z -3.43^).
- Catalyst line: August payrolls printed this morning at 162,000, more than double expectations, hitting the crowded front-end rate books and the stretched dollar ledger first. CPI follows Sep 9, five days out, and the FOMC decision Sep 17, thirteen days out; both land on the same SOFR, 2Y and USD Index books. PCE sits outside the two-week window on Sep 25.
SINCE THE SNAPSHOT
This brief reflects positioning as of the 2026-09-01 Tuesday snapshot; the price moves below are current through Friday September 4 and run on a different clock. Price action does not confirm any repositioning.
| Market | Since Tue | Level/Note |
|---|---|---|
| S&P 500 | +1.05% | ES=F ~7,723 |
| Nasdaq | +1.45% | NQ=F ~29,547 |
| Russell 2000 | +1.78% | RTY=F ~2,977 |
| VIX | -12.79% | ^VIX 14.25 |
| Bitcoin | +3.06% | ~79,774 |
| Ether | +1.63% | ~2,457 |
| UST 10Y | -0.12% | ZN=F futures down = yields up |
| UST 5Y | -0.09% | ZF=F futures down = yields up |
| UST 2Y | -0.11% | ZT=F futures down = front-end yields up |
| Dollar Index | -0.53% | DX-Y.NYB 99.14, USD down |
| JPY | +2.50% | 6J=F up = yen up vs dollar |
| Copper | +2.41% | HG=F 6.66 |
The August jobs report landed this morning and beat expectations by a wide margin, and the immediate tape read as a Fed repricing: front-end and long-end futures both slipped, equities and small caps firmed, the fear gauge dropped to the mid-14s and the dollar index eased despite the strong print, with the president publicly pressuring the Fed to cut. Crypto whipsawed around the release before finishing higher on ETF inflows. All of this is price action after the Tuesday snapshot; none of it confirms dealer, leveraged fund or asset manager repositioning. The next positioning data is not visible until next week’s report.
POSITIONING TABLE
| Rank | Market | Signal | Dlr Z (prior to cur, Δ) | Lev Z (prior to cur, Δ) | Regime (+ transition) | Key Detail |
|---|---|---|---|---|---|---|
| 1 | SOFR 3M | OPPOSED EXTREMES | +2.25 to +2.43 (Δ +0.18) | -2.00 to -1.97 (Δ +0.03) | dlr EXTREME LONG (held); lev EXTREME to ELEVATED SHORT | dealer 98.1st pctl, net +3,379,318, WoW +268,187; lev 4.8th pctl; AM z -2.05 at 0th pctl; 39% lev gross in spread structure; OptZ=-2.18 caveat; top-4 94L/91S # |
| 2 | UST 10Y | DEALER EXTREME SHORT, STANDING | -2.04 to -2.03 (Δ +0.01) | -0.52 to -0.26 (Δ +0.26) | dlr EXTREME SHORT (held); lev MODERATE SHORT to NEUTRAL | dealer 0.0th pctl, net -587,097; AM long 98th pctl (z +1.82); RV 1.03x (n=57), no amplification; OptZ=-0.88; 4 straight weeks of dealer net decline |
| 3 | UST 2Y | LEV EXTREME LONG, REAL MONEY WASHED OUT | -1.31 to -1.11 (Δ +0.20) | +2.91 to +2.66 (Δ -0.25) | dlr MODERATE SHORT (held); lev EXTREME LONG (held) | lev funds 97.1st pctl, still net short in absolute terms (-1,268,034), adding ~28,471/wk; AM z -2.38 at 0th pctl; small traders z -1.79, washed out; OptZ=-0.76 |
| 4 | Russell 2000 | LEV CROWDED SHORT DEEPENED + CONCENTRATION # | +1.24 to +1.39 (Δ +0.15) | -1.68 to -2.07 (Δ -0.39) | dlr MODERATE LONG (held); lev ELEVATED to EXTREME SHORT | dealer 98.1st pctl, outright long +96,593, top-4 30L/20S #; lev 1.9th pctl; AM z -0.58; RV 0.95x (n=100); OptZ=-0.30 |
| 5 | UST 5Y | REGIME RELEASE, TWO TIERS | -2.19 to -1.12 (Δ +1.07) | +1.99 to +1.74 (Δ -0.25) | dlr EXTREME to MODERATE SHORT; lev ELEVATED LONG (held) | flow z +2.65^, WoW +114,590, the largest rate-book repositioning this week; dealer 12.5th pctl; lev 89.4th pctl unwinding ~10,683/wk, thin lev book 61L/78S #; AM z -0.84; OptZ=-0.78 |
| 6 | Nasdaq (Consol) | REGIME TRANSITION, BOTH COHORTS CROSSED | -0.11 to -0.61 (Δ -0.50) | -0.26 to +0.82 (Δ +1.08) | dlr NEUTRAL to MODERATE SHORT; lev NEUTRAL to MODERATE LONG | flow z -2.20^, WoW -15,039; dealer 31.7th pctl; lev 73.1st pctl adding ~25,947/wk; AM z +0.32; OptZ=-1.47; Mini dlr -0.27 to -0.80 (Δ -0.53), small traders z +1.45 at 94th pctl |
| 7 | USD Index | DEALER STRETCHED SHORT + CONCENTRATION # | -1.95 to -1.92 (Δ +0.03) | +1.25 to +1.10 (Δ -0.15) | dlr ELEVATED SHORT (held); lev MODERATE LONG (held) | dealer 4.8th pctl, net -27,015; buy-side long DXY (lev +7,133, AM z +1.11) = bullish USD; MEASURED VOL 1.19x (n=34); OptZ=+0.00 caveat; top-4 74.9%, 7L/0S # |
| 8 | MXN | OPPOSED EXTREMES | -1.76 to -1.81 (Δ -0.05) | +1.50 to +1.64 (Δ +0.14) | dlr ELEVATED SHORT (held); lev MODERATE to ELEVATED LONG | dealer 3.8th pctl, net -124,691 (short peso); lev 97.1st pctl long peso, unwinding ~219/wk; AM z +1.21; RV 0.97x (n=37), no amplification; OptZ=+0.60 caveat; 4 straight weeks of dealer net decline |
| 9 | JPY | LEV SHORT DEEPENED ON OUTSIZED FLOW | +1.01 to +1.33 (Δ +0.32) | -1.09 to -1.73 (Δ -0.64) | dlr MODERATE LONG (held); lev MODERATE to ELEVATED SHORT | flow z +2.10^, WoW +36,383; dealer 90.4th pctl, net +79,321 (long yen); lev 1.0th pctl short yen; AM z -0.94; OptZ=+0.07 |
| 10 | VIX | REGIME TRANSITION to NEUTRAL, PROTECTION EASING | +0.53 to +0.41 (Δ -0.12) | +0.28 to +0.42 (Δ +0.14) | dlr MODERATE LONG to NEUTRAL; lev NEUTRAL (held) | dealer 63.5th pctl, net +48,862 long VIX = low protection demand; AM net short vol (z -1.42) confirms the complacent read; small traders net long VIX z +1.57 at 94th pctl, crowded protection bid; OptZ=+0.00 |
| 11 | Ether | REGIME TRANSITION on BOARD-LARGEST FLOW | +0.72 to -0.22 (Δ -0.94) | +0.17 to +0.81 (Δ +0.64) | dlr MODERATE LONG to NEUTRAL; lev NEUTRAL to MODERATE LONG | flow z -3.43^, WoW -3,872; dealer 35.6th pctl, net +7,358 (structural long); AM z -1.27; top-4 78.7% on a thin 5L/9S book; OptZ=-0.53 |
| 12 | Bitcoin | LEV CROWDED LONG, DEALER LONG THINNING | -0.73 to -1.03 (Δ -0.30) | +1.34 to +1.41 (Δ +0.07) | dlr MODERATE SHORT (held); lev MODERATE LONG (held) | dealer 4.8th pctl, net +2,784 (structural long at its range low); lev funds 88.5th pctl on a net of -7,620 contracts, below zero in absolute terms; AM z -1.40; RV 0.89x (n=32); top-4 61.7% on a thin 10L/10S book |
| 13 | Copper | COMMERCIALS vs MANAGED MONEY | -1.34 to -1.23 (Δ +0.11) | +1.59 to +1.41 (Δ -0.18) | Commercials MODERATE SHORT (held); Managed Money now MODERATE LONG (was ELEVATED) | Commercials 12.5th pctl, net -96,827 hedge; Managed Money 90.4th pctl, net +73,000 long; Swap Dealers z -1.74 at 1st pctl; Other Reportables z +1.26 |
| 14 | UST 30Y | LEV LONG-END LEAN | -1.14 to -1.00 (Δ +0.14) | +1.15 to +1.13 (Δ -0.02) | dlr MODERATE SHORT (held); lev MODERATE LONG (held) | dealer 18.3rd pctl; lev 86.5th pctl adding ~24,373/wk; AM long z +0.47; Other Reportables z -2.48 at 0th pctl; top-4 35.7%; OptZ=-0.19 |
| 15 | EUR | LEV CROWDED SHORT (dollar-bull) | +0.64 to +0.64 (Δ 0.00) | -1.41 to -1.38 (Δ +0.03) | dlr MODERATE LONG (held); lev MODERATE SHORT (held) | dealer net -267,578 (short euro, high end of its short range, not a long); lev 14.4th pctl short euro; AM +263,253 holds the euro long; OptZ=-1.52 |
| 16 | AUD | LEV CROWDED LONG | -0.60 to -0.68 (Δ -0.08) | +1.45 to +1.29 (Δ -0.16) | dlr MODERATE SHORT (held); lev MODERATE LONG (held) | dealer 20.2nd pctl, net -43,456 (short AUD); lev 86.5th pctl, net +49,662 long AUD; AM z -0.11; top-4 62.6%; OptZ=-0.34 |
| 17 | S&P 500 (Consol) | STANDOFF, OUTSIZED FLOW AT NEUTRAL | -0.16 to +0.23 (Δ +0.39) | +0.30 to +0.23 (Δ -0.07) | dlr NEUTRAL (held); lev NEUTRAL (held) | flow z +1.82^, WoW +43,258 without a calendar catalyst; dealer 53.8th pctl, net -701,233 (short in absolute terms); AM z -0.07; OptZ=-0.29; E-Mini dlr -0.30 to +0.08 (Δ +0.38) |
| 18 | Silver | COMMERCIALS HIGH, MM SHORT | +1.17 to +1.19 (Δ +0.02) | -0.93 to -1.00 (Δ -0.07) | Commercials MODERATE LONG (held); MM MODERATE SHORT (held) | Commercials 79.8th pctl, net -16,677 hedge; Managed Money 26.0th pctl, net +12,170 long; Swap Dealers z +0.63; small traders 23.7% of OI |
| 19 | CHF | REGIME TRANSITION + OPTIONS-IMPLIED LONG | -0.03 to +0.54 (Δ +0.57) | -0.57 to -0.81 (Δ -0.24) | dlr NEUTRAL to MODERATE LONG; lev MODERATE SHORT (held) | dealer 67.3rd pctl, net +55,743 (long CHF); OptZ=+1.51, options-implied dealer delta stretched long; lev 21.2nd pctl; AM z +0.52 |
| 20 | Gold | QUIET, HEDGERS MID-RANGE | +0.76 to +0.90 (Δ +0.14) | +0.32 to +0.05 (Δ -0.27) | Commercials MODERATE LONG (held); MM NEUTRAL (held) | Commercials 72.1st pctl, net -28,962 hedge; Managed Money net +140,811 long at 59.6th pctl; Swap Dealers z -1.03; Other Reportables 38.2% of OI |
| 21 | WTI Crude | QUIET, HEDGERS NET LONG | +0.95 to +0.77 (Δ -0.18) | +0.28 to +0.11 (Δ -0.17) | Commercials MODERATE LONG (held); MM NEUTRAL (held) | Commercials 80.8th pctl, net +309,402 (unusually net long for this cohort); Managed Money net +94,281; Swap Dealers z -0.40; deepest trader book on the board (58L/55S) |
| 22 | Natural Gas | SWAP DEALER EXTREME, REST QUIET | +0.19 to +0.25 (Δ +0.06) | -0.42 to -0.73 (Δ -0.31) | Commercials NEUTRAL (held); Managed Money now MODERATE SHORT (was NEUTRAL) | Swap Dealers z +2.04 at 99th pctl, net +210,225; Commercials 60.6th pctl, net -16,961; Managed Money net -89,523 short, aligned with the hedge |
| 23 | GBP | QUIET | +0.31 to +0.48 (Δ +0.17) | +0.97 to +0.65 (Δ -0.32) | dlr NEUTRAL (held); lev MODERATE LONG (held) | dealer 67.3rd pctl, net +59,203 (long GBP); lev 76.9th pctl, net +43,167 long GBP; AM z -0.96; top-4 47.3%; OptZ=-0.94 |
| 24 | CAD | QUIET | +0.05 to -0.05 (Δ -0.10) | -0.66 to -0.49 (Δ +0.17) | dlr NEUTRAL (held); lev MODERATE to NEUTRAL SHORT | dealer 51.0th pctl, net +117,959 (long CAD); lev 32.7th pctl, net -68,750 short CAD; AM z +0.32; top-4 55.8%; OptZ=+0.17 |
POSITIONING DYNAMICS
Equities (S&P 500, Nasdaq, Russell 2000)
The equity board split cleanly this week. Russell 2000 is now the sharpest one-sided book on the equity board: dealers hold an outright long near the top of their two-year range while leveraged funds pressed their short a full tier deeper into extreme territory, and the dealer side carries the only equity concentration flag, meaning that book is thin if it has to turn. That configuration is textbook squeeze fuel on the lev side, though it is market structure, not a directional call. Nasdaq did the opposite: both cohorts crossed the neutral boundary in opposite directions in a single week, dealers into a moderate short and leveraged funds into a moderate long, on flow the tool reads as unusually large without a calendar catalyst. Neither side is stretched yet, but the trend is divergent and it is the setup that builds a crowded trade if it extends. Note that Nasdaq small traders sit near the high end of their own range, the classic crowded contrarian posture, context only. S&P 500 is the quiet counterweight: dealers repositioned hard in contract terms yet ended the week sitting on their historical mean against a leveraged fund book doing the same, so the flow was large and the level says nothing. Dealers remain net short S&P 500 and Nasdaq in absolute terms throughout; the positive Russell reading is a genuine outright long.
Russell carries analog data. Five prior MODERATE LONG DELTA episodes returned a median +6.0% over the four weeks that followed, 4 of 5 bullish, against an unconditional base rate of +1.2% median and 59% bullish across all 474 weeks. The median runs well above the base rate and the hit rate edges it, but on five overlapping episodes this is historical context, not a signal, and the window is anchored to Tuesday, so three sessions of any such window have already elapsed.
Rates (UST 2Y, UST 5Y, UST 10Y, UST 30Y, SOFR 3M)
Read the complex as one curve, not five tenors. The front end still holds the maximum-tension book: SOFR dealers pinned at the high end of their range against leveraged funds crowded at the opposite end is the only true opposed-extremes pair in rates, and the 2Y mirrors the counterparty logic with leveraged funds at the top of their own range against measured asset managers washed out at their floor. Two standing caveats carry over unchanged and neither has softened: a large share of leveraged gross exposure in SOFR sits in spread and roll structures, so the directional read there overstates conviction, and the options-implied dealer delta does not corroborate the futures extreme, which makes it a basis or directional footprint rather than an options-hedging story.
The long end is where the level sits. The 10Y dealer short is the deepest reading on the board and has now run four consecutive weeks lower, with measured asset managers holding the mirror duration long near the top of their range. The measured realized vol for that regime shows no amplification, so the short-gamma inference stays a hypothesis and nothing more. The 5Y is the week’s actual news: the deepest dealer short of last week released two full tiers on the largest rate-book repositioning of the week, while the leveraged fund long there began unwinding. That is the front-to-back-end pressure gradient reversing shape, not resolving. The 30Y adds a leveraged fund lean toward the top of its range and an Other Reportables book pinned at its floor, a completeness detail rather than the story.
FX (USD Index, EUR, JPY, GBP, AUD, CAD, CHF, MXN)
The dollar story stays coherent and it belongs to the leveraged funds. They hold the dollar index long alongside asset managers while dealers sit stretched short the index, and the mirror shows up cleanly in the low yielders: leveraged funds are short euro, short yen at the low end of their yen range and short franc. Mind the sign discipline in the euro, where dealers read as a moderate long regime yet remain short the contract, sitting near the high end of their short range, so dealers and leveraged funds are on the same side there and the euro long belongs to asset managers. The yen is the one FX book that moved with force this week, dealer flow the tool flags as unusually large while the speculative short deepened a tier. The USD Index book also carries the only measured realized vol reading on the board that is consistent with amplification, alongside its options caveat, and its dealer ledger carries a concentration flag on an unusually thin book.
The peso is the second maximum-tension book, dealers stretched short against leveraged funds and asset managers both long, with the dealer net falling four straight weeks. Its options caveat and measured vol both argue against reading it as an options-hedging signal. The franc crossed into a moderate dealer long, the only other FX regime change, and it is the one currency where the options-implied dealer delta is itself stretched long. Sterling, the Australian dollar and the Canadian dollar sat quiet, the Australian dollar carrying a leveraged long against a dealer short that is crowded but not stretched.
The dollar index carries analog data. Five prior ELEVATED SHORT DELTA episodes returned a median -0.3% over the following four weeks with 0 of 5 bullish, against an unconditional base rate of +0.1% median and 52% bullish across all 885 weeks. The direction is one-sided against a coin-flip base rate, which is the one analog set this week that deviates meaningfully, but five episodes is five episodes; treat it as historical context only.
Crypto (Bitcoin, Ether)
Crypto dealers run structural longs, so both negative dealer readings mark the low end of a long range and not a literal short. Bitcoin’s dealer long thinned toward the floor of that range while leveraged funds held near the top of theirs, which the tool labels a crowded long even though the leveraged book is net short in absolute terms; read the label as range position, not direction. Ether was the board’s largest relative repositioning, dropping its dealer regime to neutral in one week while its leveraged book crossed the other way, and the dealer read there is now firmer than Bitcoin’s, which the narrative flags as possible intra-crypto rotation. Both crypto books are thinly held with a handful of traders controlling most of the dominant side, so the dealer signal in each carries that structural caveat. The narrative also notes Bitcoin stress is not mirrored in equity positioning, so this is crypto-specific and not a broad risk-off read.
Bitcoin’s analogs: five prior MODERATE SHORT DELTA episodes returned a median +8.5% over four weeks with 3 of 5 bullish, against a base rate of +2.1% median and 57% bullish across 621 weeks. The median runs above baseline while the hit rate does not; on five episodes it is context only.
Commodities (Gold, Silver, WTI Crude, Copper, Natural Gas)
Copper holds the only live hedger-versus-speculator tension: Commercials sit near the low end of their two-year range while Managed Money holds a large long that eased a tier this week, the canonical opposed configuration, and the Swap Dealer book sits at its own floor. This is positioning state, nothing more. Gold and silver Commercials both sit moderately high in their hedging ranges with Managed Money split, gold’s speculative book neutral and silver’s leaning short, so neither metal shows a stretch worth a headline. WTI Commercials are unusually net long for a cohort that normally carries a structural short, sitting high in their range on a deep and broadly held trader book. Natural gas is quiet on both the hedger and the speculative side; its only notable reading is the Swap Dealer book pinned near the top of its range, which is context, not a story.
COST BASIS LEVELS
Descriptive P&L facts about the aggregate book, not triggers; 2026 testing found no covering response after price crosses a cohort basis. Prices as of 2026-09-04.
| Market | Dealer Basis (Low-High) | Current Price | Dlr Gap | Lev Basis (Low-High) | Lev Gap |
|---|---|---|---|---|---|
| S&P 500 (Consol) | 6,622 – 6,824 | 7,722 | above zone | 7,063 – 7,288 | above zone |
| Nasdaq (Consol) | – | 29,543 | – | 27,679 – 29,092 | above zone |
| Russell 2000 | 2,825 – 2,926 | 2,976 | above zone | 2,855 – 2,952 | above zone |
| VIX | 15.78 – 19.14 | 14.26 | below zone | 14.30 – 16.03 | just below zone |
| USD Index | 99.49 – 100.94 | 99.14 | below zone | 99.13 – 99.93 | inside zone, at the low edge |
| Bitcoin | 76,584 – 83,258 | 79,727 | inside zone, mid | 72,433 – 78,879 | above zone |
| Ether | 2,222 – 2,454 | 2,456 | just above zone | 2,122 – 2,321 | above zone |
| Gold | 4,149 – 4,331 | 4,482 | above zone | 3,961 – 4,145 | above zone |
| Silver | 57.35 – 63.52 | 66.85 | above zone | 65.28 – 72.69 | inside zone, low end |
| WTI Crude | 77.61 – 91.70 | 91.33 | inside zone, top | 79.07 – 91.31 | just above zone |
| Copper | 5.60 – 5.85 | 6.66 | above zone | 5.76 – 6.02 | above zone |
| Natural Gas | 2.84 – 3.10 | 2.94 | inside zone, mid | 2.78 – 3.01 | inside zone, upper |
Commodity rows read as Commercials (dealer columns) and Managed Money (lev columns). Rates are excluded from cost basis by construction. Most equity and commodity books trade above both cohort zones; the VIX and dollar index dealer books are the two trading through from below.
BOTTOM LINE
Size rate and dollar risk off the front end this week, not the long end: the 5Y released and the 10Y did not, so the curve’s positioning gradient has flipped shape into CPI and the FOMC, and the SOFR and 2Y books remain the ones a surprise would force. In equities, Russell 2000 is the only book where a catalyst meets genuinely thin, one-sided inventory on both cohorts, so treat small-cap exposure as the position most sensitive to a squeeze if the tape turns.
Data: CFTC COT Report 2026-09-01 | Prices as of 2026-09-04 | Analysis window: 104 weeks
Smart Money Pulse - '26 W35
The Bond Market's Smart Money Just Reached for Its Deepest Short in Two Years
For weeks the tension in this data lived in stocks and the dollar. This week it moved decisively into one place: the long end of the bond market. Dealers, the professional counterparties who usually sit across from everyone else’s trades, pushed their positions in both the 5-Year and 10-Year Treasury to the most bearish reading in two years. On the 5-Year (z=-2.19) it is now the deepest short anywhere on the board.
In plain terms, the smart money has leaned hard into a bet that longer-term interest rates hold up or climb, not fall. That matters for an ordinary portfolio because it is a direct read on the part of the bond market where your longer-dated bond funds live. When the pros crowd this far to one side, the useful takeaway is not which way it points but that the book is now stretched and thin, the kind of setup that can move quickly if the story changes. It is worth saying plainly: this is a description of where the big players sit, not a forecast of where rates go next.
The story is about to get tested. PCE, the Federal Reserve’s preferred inflation gauge, is due today (August 28), with the monthly jobs report on September 4 and CPI, another key inflation reading, on September 9. All three land while this bet is at its most extreme. Remember this is Tuesday’s snapshot: since then, a hawkish read of incoming Fed chair Kevin Warsh’s Jackson Hole remarks has already nudged yields higher, but that shift will not show up in the positioning data until next week.
This Week's Positioning
The long end of the bond market: the deepest short on the board
Dealers drove their positions in both the 5-Year and 10-Year Treasury two full steps deeper this week, landing both at a two-year short extreme. The 10-Year is the one where the options market backs up the move, which suggests part of it is hedging flow; the 5-Year shows no such fingerprint and looks more like a straight directional or basis bet. Either way, this is where the fresh stress went, and it sits right on top of today’s inflation number.
Watch: the 20+ year Treasury fund TLT is the cleanest gauge a regular investor can follow; a sharp move there around the PCE, jobs and CPI reports is the early tell that this crowded book is being forced to shift.
The short end is leaning the other way
While dealers pile into shorts at the long end, they sit at the high end of their range on SOFR futures (the market’s bet on short-term interest rates), essentially the mirror image, with the fast money crowded on the opposite side. It is best read as one big curve trade, a wager that the front and back of the rate market pull apart, rather than a single directional call. One caveat keeps it honest: a large chunk of the fast-money position here is in roll-and-spread structures, so it looks more one-sided than the real conviction behind it.
Watch: if the front-end and long-end books start moving together instead of apart, that is the sign the curve bet is unwinding; today’s PCE print is the first thing that could set it off.
Volatility: the fear premium came out
The VIX slipped into cheaper territory, under 15, as big institutions stayed tilted toward selling volatility rather than buying protection. That is a calm, fear-easing posture, not a warning; it simply means downside insurance is inexpensive at the moment. The market is not paying up for hedges right now, which is a condition to note rather than a signal to trade.
Watch: with the VIX this low, the cost of portfolio protection is near the bottom of its range, worth keeping in view if you have been meaning to hedge.
Elsewhere the board is quiet or unchanged. The dollar is still the most crowded corner in the report, with the fast money jammed into a stronger-dollar bet, but nothing moved there this week, so last week’s story simply stands. The Nasdaq’s squeeze remains unwound and the S&P sits balanced near its norm, though the small-trader crowd is now leaning unusually hard long the Nasdaq, historically a spot the pros sometimes fade. Small-cap dealers keep their lone long against a crowded fast-money short; the British pound, the Canadian dollar and the Swiss franc all drifted back to neutral as dealers trimmed; Bitcoin’s fast money stays crowded near the top of its range; and gold, silver and copper show the usual hedger-versus-speculator gap with nothing at an extreme.
Know Where You Stand
- Your longer-dated bond funds sit on the exact trade the smart money just pushed to an extreme. If you own a long-duration fund like TLT, or the bond sleeve of a target-date fund, this is the week to know your interest-rate exposure rather than react to it, because a crowded, stretched book runs straight into three inflation and jobs reports over the next two weeks.
- Downside protection is about as cheap as it gets right now. With the VIX under 15 and institutions leaning toward selling volatility, the price of hedging a stock portfolio through something like SPY puts or a small volatility position is near the low end of its range, which is worth knowing whether or not you choose to act on it.
- The crowded dollar bet still runs underneath your international and commodity holdings. A firmer dollar since Tuesday pressures gold and overseas funds, so if you hold GLD or a broad international fund, that is the sleeve to keep an eye on, not because a move is coming but because you are quietly on the other side of the market’s most one-sided trade.
Data: CFTC COT Report 2026-08-25 | Prices as of 2026-08-28 | 104-week lookback
Liquidity Trajectory '26 W35
LIQUIDITY TRAJECTORY
CFTC Report Date: 2026-08-25 | Generated: 2026-08-28 15:40 ET
EXECUTIVE SUMMARY
- Duration is the week’s story: dealers pressed both the UST 5Y and 10Y two full tiers into EXTREME SHORT (5Y dlr z +1.34 to -2.19, 10Y +1.44 to -2.04), the deepest dealer shorts on the board. The 10Y is the one tenor where the options book corroborates the futures extreme (OptZ -1.80); the 5Y carries no options corroboration and reads as a basis or directional footprint. Both printed unusually large event-week flow.
- The front end holds the opposite counterparty configuration, keeping the curve split. SOFR 3M dealers held their EXTREME LONG against a lev fund EXTREME SHORT (OPPOSED EXTREMES), and the 2Y still pins a 99th-percentile lev fund long against a washed-out asset-manager book, though the dealer short eased a tier to MODERATE. Read the rates board as one curve trade, front-end long-delta against long-end short-delta, not eight tenors.
- The equity extreme drained. Nasdaq dealers collapsed from MODERATE LONG to NEUTRAL on an outsized event-week flow (Consol event z -3.67), and the S&P E-Mini slipped back to NEUTRAL; the equity group dealer average is now +0.32z. Russell 2000 is the lone standing equity extreme, dealers outright long with lev funds crowded on the opposite side near their floor. VIX ticked into a MODERATE LONG dealer read with asset managers still net short vol, a fear-easing posture.
- The dollar setup stayed coherent and stretched: USD Index dealers held an ELEVATED SHORT against a crowded-long lev book on a heavily concentrated ledger, while MXN kept its ELEVATED dealer short. Three FX majors (GBP, CAD, CHF) transitioned back to NEUTRAL as dealer longs bled off, and the euro’s lev short unwound a tier from EXTREME to MODERATE. The speculative lean remains long the dollar.
- Catalyst line: PCE is due today (Aug 28) and hits the crowded rate books and the stretched dollar first; NFP follows Sep 4 and CPI Sep 9, both inside the window and both rate-and-dollar sensitive. FOMC is further out on Sep 17. The next positioning data is not visible until next week’s report.
SINCE THE SNAPSHOT
This brief reflects positioning as of the 2026-08-25 Tuesday snapshot; prices are current through Friday August 28.
| Market | Since Tue | Level/Note |
|---|---|---|
| S&P 500 | +0.4% | futures firmer |
| Nasdaq | +0.8% | tech bid |
| Russell 2000 | -1.0% | small caps lag |
| VIX | -6.5% | to 14.44 |
| Bitcoin | -1.2% | back below $78k |
| Ether | -0.2% | ~2,438 |
| UST 10Y | -0.9% | futures down = yields up |
| UST 2Y | -0.4% | futures down = front-end yields up |
| Dollar Index | +0.7% | USD firmer |
| EUR | -0.8% | euro lower vs USD |
The dominant post-snapshot driver is Kevin Warsh’s Jackson Hole debut as incoming Fed chair, read as a hawkish inflation-fighting tilt: yields backed up across the curve, the dollar firmed and Bitcoin lost the $80k handle, while large-cap equities held firm and small caps lagged. No scheduled macro release printed inside the Tuesday-to-Friday window; PCE is due today (Aug 28). These are price moves only; whether dealers or lev funds repositioned against them is not visible until next week’s report.
POSITIONING TABLE
| Rank | Market | Signal | Dlr Z (prior to cur, Δ) | Lev Z (prior to cur, Δ) | Regime (+ transition) | Key Detail |
|---|---|---|---|---|---|---|
| 1 | UST 5Y | REGIME TRANSITION, OPPOSED EXTREMES | -1.34 to -2.19 (Δ -0.85) | +1.92 to +1.99 (Δ +0.07) | dlr MODERATE to EXTREME SHORT; lev ELEVATED LONG (held) | dlr 1.0th pctl; event z -2.35^, flow z -2.28^; RV 1.19x (n=54); OptZ=-0.60 not corroborating; AM 26th pctl |
| 2 | UST 10Y | REGIME TRANSITION, OPTIONS CORROBORATED | -1.44 to -2.04 (Δ -0.60) | -0.85 to -0.52 (Δ +0.33) | dlr MODERATE to EXTREME SHORT; lev MODERATE SHORT (held) | dlr 0.0th pctl; event z -2.10^; OptZ=-1.80 corroborates; RV 1.03x (n=57, not evident); AM 97th pctl (z +1.82) |
| 3 | SOFR 3M | OPPOSED EXTREMES | +2.34 to +2.25 (Δ -0.09) | -1.97 to -2.00 (Δ -0.03) | dlr EXTREME LONG (held); lev ELEVATED to EXTREME SHORT | dlr 94.2th pctl; 83L/98S#; 39% lev spread caveat; OptZ=-1.08 not corroborating; event z -0.44 |
| 4 | UST 2Y | REGIME TRANSITION, CROWDED LONG lev | -1.86 to -1.31 (Δ +0.55) | +3.04 to +2.91 (Δ -0.13) | dlr ELEVATED to MODERATE SHORT; lev EXTREME LONG (held) | lev 99.0th pctl; AM 0th pctl (z -2.40); Nonrept 0th pctl (z -3.18); event z +1.32 |
| 5 | USD Index | ELEVATED SHORT vs CROWDED LONG lev | -1.97 to -1.95 (Δ +0.02) | +1.09 to +1.25 (Δ +0.16) | dlr ELEVATED SHORT (held); lev MODERATE LONG (held) | dlr 1.9th pctl; 6L/4S#, top-4 75%; AM +0.90; RV 1.19x (n=34); OptZ=+0.00 |
| 6 | MXN | ELEVATED SHORT vs CROWDED LONG lev | -1.55 to -1.76 (Δ -0.21) | +1.41 to +1.50 (Δ +0.09) | dlr ELEVATED SHORT (held); lev MODERATE LONG (held) | lev 97.1th pctl; RV 0.97x (no vol tilt); OptZ=+0.60 not corroborating; event z -1.30 |
| 7 | Nasdaq (Consol) | REGIME TRANSITION, EXTREME DRAINED | +0.88 to -0.11 (Δ -0.99) | -1.22 to -0.26 (Δ +0.96) | dlr MODERATE LONG to NEUTRAL; lev MODERATE SHORT to NEUTRAL | event z -3.67^ Consol / -2.28^ Mini; OptZ=-2.28; Nonrept 96th pctl (z +1.77); Mini dlr -0.27 / lev -0.42, both NEUTRAL |
| 8 | Russell 2000 | OUTRIGHT LONG vs CROWDED SHORT lev # | +1.29 to +1.24 (Δ -0.05) | -1.80 to -1.68 (Δ +0.12) | dlr MODERATE LONG (held); lev ELEVATED SHORT (held) | dlr 93.3th pctl, 30L/19S#; lev 2.9th pctl; AM 21st pctl; event z -0.07 |
| 9 | VIX | REGIME TRANSITION, AM SHORT VIX (fear easing) | +0.27 to +0.53 (Δ +0.26) | +0.69 to +0.28 (Δ -0.41) | dlr NEUTRAL to MODERATE LONG; lev MODERATE LONG to NEUTRAL | AM net short VIX z -1.05; 69.2th pctl dlr; short covering |
| 10 | Copper | CROWDED LONG spec (Commercials vs Managed Money) | -1.27 to -1.34 (Δ -0.07) | +1.73 to +1.59 (Δ -0.14) | Commercials MODERATE SHORT (held); Managed Money ELEVATED LONG (held) | Managed Money 97.1th pctl; Swap Dealers z -1.80 (0th pctl); Commercials 8.7th pctl |
| 11 | Ether | REGIME TRANSITION, intra-crypto rotation | -0.13 to +0.72 (Δ +0.85) | +0.96 to +0.17 (Δ -0.79) | dlr NEUTRAL to MODERATE LONG; lev MODERATE LONG to NEUTRAL | event z +4.29^; dlr 77.9th pctl; AM 10th pctl (z -1.64); stronger than BTC |
| 12 | EUR | CROWDED SHORT lev, unwinding | +1.04 to +0.64 (Δ -0.40) | -2.10 to -1.41 (Δ +0.69) | dlr MODERATE LONG (held); lev EXTREME to MODERATE SHORT | lev 12.5th pctl; event z -2.37^, flow; OptZ=-1.06; 4-wk dealer momentum lower |
| 13 | CAD | REGIME TRANSITION, OUTSIZED FLOW | +0.65 to +0.05 (Δ -0.60) | -1.48 to -0.66 (Δ +0.82) | dlr MODERATE LONG to NEUTRAL; lev MODERATE SHORT (held) | event z -3.87^, flow z -3.54^; long liquidation; 4-wk dealer momentum lower |
| 14 | CHF | REGIME TRANSITION, OUTSIZED FLOW | +0.78 to -0.03 (Δ -0.81) | -0.62 to -0.57 (Δ +0.05) | dlr MODERATE LONG to NEUTRAL; lev MODERATE SHORT (held) | event z -3.56^; OptZ=+1.24; long liquidation |
| 15 | Bitcoin | CROWDED LONG lev | -0.86 to -0.73 (Δ +0.13) | +1.51 to +1.34 (Δ -0.17) | dlr MODERATE SHORT (held); lev ELEVATED to MODERATE LONG | dlr 13.5th pctl; lev 86.5th pctl; AM 11th pctl (z -1.65); top-4 58% |
| 16 | AUD | REGIME TRANSITION, CROWDED LONG lev | -0.49 to -0.60 (Δ -0.11) | +1.42 to +1.45 (Δ +0.03) | dlr NEUTRAL to MODERATE SHORT; lev MODERATE LONG (held) | lev 89.4th pctl, top-4 71%; new dealer longs |
| 17 | GBP | REGIME TRANSITION | +0.66 to +0.31 (Δ -0.35) | +0.59 to +0.97 (Δ +0.38) | dlr MODERATE LONG to NEUTRAL; lev MODERATE LONG (held) | OptZ=-1.82; 4-wk dealer momentum lower |
| 18 | JPY | DEALER LONG vs CROWDED SHORT lev | +1.03 to +1.01 (Δ -0.02) | -0.86 to -1.09 (Δ -0.23) | dlr MODERATE LONG (held); lev MODERATE SHORT (held) | dlr 84.6th pctl; Nonrept 6th pctl (z -1.26) |
| 19 | UST 30Y | DEALER SHORT vs CROWDED LONG lev | -1.48 to -1.14 (Δ +0.34) | +0.57 to +1.15 (Δ +0.58) | dlr MODERATE SHORT (held); lev MODERATE LONG (held) | lev 87.5th pctl; Other 0th pctl (z -1.57); OptZ=-1.02; event z +1.44 |
| 20 | S&P 500 (E-Mini) | REGIME TRANSITION (marginal) | -0.52 to -0.30 (Δ +0.22) | +0.93 to +0.47 (Δ -0.46) | dlr MODERATE SHORT to NEUTRAL; lev NEUTRAL (held) | Consol dlr -0.16 stayed NEUTRAL, event z +1.88^; AM +0.17; Nonrept 82nd pctl |
| 21 | Silver | COMMERCIALS HIGH | +1.31 to +1.17 (Δ -0.14) | -1.07 to -0.93 (Δ +0.14) | Commercials MODERATE LONG (held); Managed Money MODERATE SHORT (held) | Commercials 77.9th pctl; Other 0th pctl (z -2.00) |
| 22 | WTI Crude | COMMERCIALS HIGH | +0.89 to +0.95 (Δ +0.06) | -0.02 to +0.28 (Δ +0.30) | Commercials MODERATE LONG (held); Managed Money NEUTRAL (held) | Commercials 83.7th pctl; Swap Dealers z -1.42 |
| 23 | Gold | COMMERCIALS HIGH | +0.99 to +0.76 (Δ -0.23) | +0.16 to +0.32 (Δ +0.16) | Commercials MODERATE LONG (held); Managed Money NEUTRAL (held) | Commercials 71.2th pctl; Swap Dealers z -1.56 |
| 24 | Natural Gas | SWAP DEALER EXTREME | +0.28 to +0.19 (Δ -0.09) | -0.93 to -0.42 (Δ +0.51) | Commercials NEUTRAL (held); Managed Money NEUTRAL (held) | Swap Dealers z +2.05 (99th pctl); Commercials 55.8th pctl |
Prior endpoints from the 2026-08-18 CSV.
POSITIONING DYNAMICS
Equities (S&P 500, Nasdaq, Russell 2000)
The equity extreme that dominated the last two weeks is gone. Nasdaq was the maximum-tension book and both sides collapsed to neutral at once, dealers off the top of their range and lev funds off the floor, on an outsized event-week repositioning. Read it as tension deflated, not a counterparty flip. The S&P is the marginal item: the E-Mini nudged back across the boundary into the neutral band while the Consolidated never left it; S&P 500 dealers stay net short in absolute terms throughout, so treat it as drift, not a regime event. Russell is now the lone standing equity extreme and the cleanest one-sided read on the board: dealers hold an outright long here, with lev funds crowded on the opposite side near the floor of their range, and it carries the only equity dealer concentration flag, so that book is thinner if it turns. That lev crowd is squeeze fuel, but nothing moved this week, so it is a standing configuration rather than fresh news.
Russell’s MODERATE LONG DELTA regime carries analogs: prior episodes on 2026-03-31 (+10.7%), 2025-08-26 (+3.3%), 2025-07-29 (+8.9%), 2025-05-27 (+6.0%) and 2025-05-13 (-0.3%), a median +6.0% over four weeks with 4 of 5 bullish, against an unconditional base rate of +1.2% median and 60% bullish across all weeks (n=473). That sits above baseline on both hit rate and magnitude, historical context only and never high-conviction. Forward windows anchor to the Tuesday snapshot, so roughly three sessions of any four-week horizon have already elapsed by publication.
Rates (UST 2Y, UST 5Y, UST 10Y, UST 30Y, SOFR 3M)
Read the curve, not the tenors. The long end is where the fresh stress went: dealers drove both the 5Y and 10Y two tiers deeper into a heavy short, and it is the one part of the board where flow and level coincide this week. The two duration extremes are not the same signal, though. Only the 10Y is echoed in the options book, so its footprint has an options-hedging component; the 5Y shows no such corroboration and reads as basis or directional flow, and the measured realized-vol tilt is real at the 5Y but absent at the 10Y (a standing caveat, unchanged in direction). The front end runs the opposite counterparty story: SOFR dealers sit at the extreme high of their range against a lev fund short at its floor, a standing OPPOSED EXTREMES, while the 2Y still pins a near-record lev fund long against a washed-out real-money book even as the dealer short eased a tier. The SOFR spread-structure share reinforces that the directional read there overstates conviction. Net, front-end long-delta against long-end short-delta is consistent with curve repositioning, not a single directional rates view, and it all sits directly in front of today’s PCE print.
FX (USD Index, EUR, JPY, GBP, AUD, CAD, CHF, MXN)
The dollar setup is coherent from both ends. Dealers sit stretched short the USD Index near the bottom of their range while the buy-side runs the mirror, lev funds crowded long the dollar against them on a heavily concentrated, thin ledger; asset managers lean the same way. The euro squares with it: dealers are less short than usual, holding at the high end of their own short range, while lev funds sit short, so the speculative lean is firmly long the dollar read from the other side. Both euro dealers and lev funds are net short the currency in absolute terms, so they sit on the same side and the long rests with asset managers and other reportables, not with dealers; the lev short did unwind a tier this week but stays the crowded book. The active FX flow was the exits: GBP, CAD and CHF all transitioned back to neutral as dealer longs liquidated, CAD and CHF on the board’s largest outsized FX prints, and AUD tipped into a fresh dealer short against a crowded-long lev book. MXN held its stretched dealer short against a crowded-long lev configuration. FX asset-manager extremes often reflect structural hedging rather than directional views, so these reads are lev-fund-led.
Crypto (Bitcoin, Ether)
Crypto rotated toward Ether. Ether’s dealer book firmed out of neutral into a moderate long on the board’s single largest outsized event-week print, while its lev funds slid back to neutral and its asset managers sit near the bottom of their range. Bitcoin held its shape, a moderate dealer short and a crowded-long lev book against a dealer position concentrated in very few traders, with asset managers washed out. The dealer gap between the two is consistent with intra-crypto rotation toward ETH. Crypto dealers run a structural long (a standing caveat), so these near-zero-to-negative dealer reads are mid-range, not shorts.
COST BASIS LEVELS
| Market | Dealer Basis (Low-High) | Current Price | Dlr Gap | Lev Basis (Low-High) | Lev Gap |
|---|---|---|---|---|---|
| USD Index | 99.49-100.94 | 99.66 | through zone | 99.13-99.93 | through zone |
| Russell 2000 | 2812-2917 | 2984 | above zone | 2847-2949 | above zone |
| VIX | 15.78-19.14 | 14.44 | below zone | – | – |
| Bitcoin | 76584-83239 | 77674 | through zone | 72433-78870 | through zone |
| Ether | 2231-2454 | 2438 | through zone | 2135-2321 | above zone |
| EUR | 1.14-1.15 | 1.16 | above zone | 1.14-1.15 | above zone |
| Copper | 5.59-5.84 | 6.64 | above zone | 5.76-6.02 | above zone |
| MXN | 0.06-0.06 | 0.06 | at zone | 0.06-0.06 | at zone |
The USD Index and Bitcoin are the featured books trading through both their basis zones this week; VIX sits below its zone and Russell, EUR and Copper sit above. This is a descriptive P&L fact about the aggregate book, not a trigger; no covering response follows from crossing a basis zone.
BOTTOM LINE
Size the long-end duration blowout (5Y and 10Y dealers driven to EXTREME SHORT, with only the 10Y options-corroborated) and the standing front-end opposed extremes as the live, unresolved rates configuration into today’s PCE print and the Sep 4 NFP; treat the equity de-extreming as tension released rather than a direction to lean on.
Data: CFTC COT Report 2026-08-25 | Prices as of 2026-08-28 | Analysis window: 104 weeks
Smart Money Pulse - '26 W34
Everyone's Watching Bonds. The Real Crowd Is in the Dollar.
Two stories have dominated this data lately, and both are now settled background: the month-long tech standoff in the Nasdaq unwound, and the tension slid into short-term Treasuries right as PCE approaches. Neither has moved since the last read. What almost nobody is talking about is where the single most one-sided bet on the whole board actually sits, and it is not in stocks or bonds at all. It is in the dollar.
The fast money has piled into a stronger-dollar trade with unusual conviction: hedge funds are at a two-year extreme short the euro (z=-2.10) and crowded long the dollar index, with the dealers who take the other side stretched the opposite way. When a bet gets this lopsided, the useful thing is not guessing which way it points but knowing it tends to unwind sharply if it starts going wrong. And it already is nudging offside: since Tuesday’s snapshot the dollar has slipped, not climbed.
It is not only the fast money leaning this way either; the big long-only funds are tilted long the dollar too, so the lean is broad rather than a single desk’s position. And it rhymes with the crowded rate books everyone is already watching: a bet on a stronger dollar and a bet against short-term Treasuries are close cousins, both essentially a wager that the Federal Reserve stays firm and rates hold up. That is why the same inflation number hanging over the bond crowd also hangs over this one.
For a normal portfolio this matters more than it sounds. Your international funds and any commodity or gold exposure sit on the opposite side of that crowded currency bet; a stronger dollar pressures them, a weaker one helps. So the most crammed corner of the market this week is one a domestic-plus-international investor is quietly exposed to, without touching a single currency future. Keep in mind this is all Tuesday’s picture, and the price moves since then are a different clock that will not show up in the positioning until next week.
This Week's Positioning
The dollar: the crowd is all leaning one way
Hedge funds are jammed into a stronger-dollar bet from both directions at once, holding a two-year extreme short in the euro (z=-2.10) and a crowded long in the dollar index, while dealers lean the opposite way. The euro short is the standout: it is not just crowded, it is at the very edge of its two-year range, the kind of positioning that has little room left to build. The Mexican peso tipped into stretched-short territory for the dealers this week too, another piece of the same broad dollar lean. None of this forecasts the dollar’s direction; it simply marks the trade as unusually one-sided, which is exactly the kind of setup that can move fast if the crowd gets forced out.
Watch: a firm, sustained move higher in a broad international fund like VXUS would be the early tell that the crowded dollar-long is starting to unwind. UUP is the direct way to track the dollar itself if you follow it.
Everything else is the story you already knew
The two headline setups have not budged. The Nasdaq’s month-long squeeze is still unwound, back near normal after both sides stepped away from their extremes, so the tech side stays calmer than it was a month ago. And short-term Treasuries remain the most crowded book in the report: hedge funds pinned at a two-year extreme against dealers leaning the other way, with the long-only bond managers washed out to the very bottom of their range. SOFR futures (the market’s bet on short-term interest rates) show the same tension mirrored, dealers stretched to the high end of their own range. All of it sits directly in front of the inflation print, which means the big players are essentially waiting on data, not moving this week.
Watch: PCE (the Federal Reserve’s preferred inflation measure, due August 28) is the catalyst that hits those lopsided rate books first; until it lands, the positioning is unlikely to shift.
Elsewhere the board is genuinely quiet. Small-cap dealers keep a rare long against a crowded hedge-fund short concentrated in a few large traders; the S&P 500 sits in a balanced standoff with dealers parked near their historical norm; the fear gauge stayed cheap under 16 with big institutions leaning toward selling volatility rather than buying protection; and Bitcoin’s hedge funds are still crowded near the top of their range even before this week’s sharp price jump, which came from the tape and not from any fresh positioning you can see yet.
Know Where You Stand
- The market’s most crowded currency bet runs straight through your international sleeve. The fast money is jammed into a stronger-dollar trade, so if you hold international funds like VXUS or VEA, or gold and commodity exposure, you are on the other side of it; a crowded, offside bet is worth knowing about because it can unwind quickly, and UUP is the simplest way to watch the dollar itself move.
- The bond-market crowd is unchanged and nearly out of runway before PCE. Short-term Treasuries hold the most one-sided positioning in the report and the inflation print is only days away, so if you own broad bond funds like BND or a target-date fund’s bond sleeve, this is a moment to know your interest-rate exposure rather than trade the number, since a surprise either way hits this lopsided book first. The tension is concentrated at the short end, but the longer-dated part of the market carries its own real-money duration bet, so a bond index fund is exposed to both.
- Nothing in the positioning actually changed this week; only the prices did. Bitcoin ripped, the dollar slipped and stocks drifted lower, but none of that is confirmed by fresh smart-money data, so the disciplined move is to resist re-allocating on the tape and let next week’s report show whether the big players truly shifted.
Data: CFTC COT Report 2026-08-18 | Prices as of 2026-08-25 | 104-week lookback
Liquidity Trajectory '26 W34
LIQUIDITY TRAJECTORY
CFTC Report Date: 2026-08-18 | Generated: 2026-08-21 15:55 ET
EXECUTIVE SUMMARY
- The two-sided Nasdaq extreme collapsed. Dealers came in from EXTREME LONG DELTA to MODERATE LONG (Consol z +0.88, 77.9th percentile) and leveraged funds from EXTREME SHORT to MODERATE SHORT (z -1.22), the board’s dominant regime move. It ran on the largest event-phase repositioning on the board, an event z of -5.60^ on the Consolidated (Mini -2.41^) during Monthly OpEx, dealers dumping longs far faster than typical for the phase. The options book still reads stretched short (OptZ=-2.37) and does not corroborate the futures normalization; treat it as a basis or directional footprint, not gamma.
- The board’s maximum tension rotated to the rate front end. The UST 2Y is an OPPOSED EXTREMES standoff: dealers ELEVATED SHORT (z -1.86, 1.9th percentile) against leveraged funds at an EXTREME LONG 99th percentile (z +3.04) still building ~93,853/wk, with measured asset managers washed out at the 0th percentile (AM z -2.42). This dealer regime historically ran realized vol 1.25x the all-week average (n=63), the one book with a measured vol tilt; the options book does not corroborate (OptZ=+0.79 caveat), so read the futures short as basis or directional hedging.
- Russell 2000 holds the cleanest one-sided structural read: dealers outright net long (+86,131 contracts, z +1.29, 96.2th percentile) with the board’s only dealer concentration flag (top-4 31L/19S #) against a CROWDED SHORT lev position at an ELEVATED low (z -1.80, 1.9th percentile). The 10Y is the real-money mirror, asset managers holding an elevated duration long at the 97th percentile (AM z +1.83) while the dealer short deepened within its tier and the options-implied dealer delta corroborates short (OptZ=-1.42).
- Crypto’s tension sits with leveraged funds and asset managers, not dealers. Bitcoin holds its CROWDED LONG, dealers MODERATE SHORT (z -0.86) against lev funds ELEVATED LONG at the 90th percentile (z +1.51) and asset managers near their floor (AM z -1.66, 8th percentile); Ether’s asset managers are pinned at an EXTREME SHORT (z -2.07, 5th percentile). Crypto dealers run a structural long, so these negative dealer reads are mid-range, not shorts, and both books are thinly held.
- Catalyst line: PCE lands Aug 28, roughly 7 days out, straight into the crowded rate books, the 2Y OPPOSED EXTREMES and the 10Y real-money duration long; NFP follows Sep 4, roughly 14 days out. No scheduled macro released inside this reporting window; Jackson Hole and Nvidia earnings are the near-term news drivers.
SINCE THE SNAPSHOT
This brief reflects positioning as of the 2026-08-18 Tuesday snapshot; the price moves below are current through Friday August 21 and are a different clock. Price action does not confirm any repositioning.
| Market | Since Tue | Level/Note |
|---|---|---|
| S&P 500 | -0.2% | ES=F ~7,699 |
| Nasdaq | -0.6% | NQ=F ~29,408 |
| Russell 2000 | -0.1% | RTY=F ~3,023 |
| VIX | -4.5% | ^VIX 15.13 |
| Bitcoin | +19.2% | ~77,099 |
| Ether | +25.9% | ~2,414 |
| UST 10Y | -0.3% | ZN=F futures down = yields marginally up |
| UST 2Y | -0.1% | ZT=F futures down = front-end yields marginally up |
Crypto ripped after the snapshot, Bitcoin clearing 77,000 and Ether up roughly a quarter, on a Treasury repurchase announcement that markets read as easing supply pressure. Equities drifted lower on the week with rising yields the drag, as the Treasury’s interventionist push to subdue rates failed to hold; the fear gauge eased below 15.5. These are price moves only, all after the Tuesday snapshot, and none of them confirm dealer or lev-fund repositioning. The next positioning data is not visible until next week’s report.
POSITIONING TABLE
| Rank | Market | Signal | Dlr Z (prior to cur, Δ) | Lev Z (prior to cur, Δ) | Regime (+ transition) | Key Detail |
|---|---|---|---|---|---|---|
| 1 | Nasdaq (Consol) | REGIME NORMALIZING (both cohorts) | +2.19 to +0.88 (Δ -1.31) | -2.43 to -1.22 (Δ +1.21) | dlr EXTREME to MODERATE LONG; lev EXTREME to MODERATE SHORT | dealer 77.9th pctl; event z -5.60^ Monthly OpEx, WoW -38,562; OptZ=-2.37 not corroborating (basis/directional); Mini dlr +2.06 to +0.72 / lev -2.64 to -1.37, event z -2.41^ |
| 2 | UST 2Y | OPPOSED EXTREMES | -1.67 to -1.86 (Δ -0.19) | +2.75 to +3.04 (Δ +0.29) | dlr ELEVATED SHORT (held); lev EXTREME LONG (held) | dealer 1.9th pctl; lev 99th pctl adding ~93,853/wk; AM 0th pctl (z -2.42); RV 1.25x (n=63); OptZ=+0.79 caveat |
| 3 | Russell 2000 | OUTRIGHT LONG + CONCENTRATION # | +1.39 to +1.29 (Δ -0.10) | -1.66 to -1.80 (Δ -0.14) | dlr MODERATE LONG (held); lev ELEVATED SHORT (held) | dealer 96.2th pctl, outright +86,131, top-4 31L/19S #; lev 1.9th pctl CROWDED SHORT; AM 21st pctl (z -0.67); OptZ=+1.10 |
| 4 | UST 10Y | AM ELEVATED LONG + OPTIONS SHORT | -1.37 to -1.44 (Δ -0.07) | -0.63 to -0.85 (Δ -0.22) | dlr MODERATE SHORT (held); lev MODERATE SHORT (held) | dealer 3.8th pctl; AM long 97th pctl (z +1.83); OptZ=-1.42 corroborating short; WoW -15,128 |
| 5 | Bitcoin | LEV CROWDED LONG | -0.79 to -0.86 (Δ -0.07) | +1.63 to +1.51 (Δ -0.12) | dlr MODERATE SHORT (held); lev ELEVATED LONG (held) | dealer 7.7th pctl; lev 90.4th pctl; AM 8th pctl (z -1.66); top-4 60.5%, thin 10L/14S book; analog near baseline |
| 6 | Ether | AM EXTREME SHORT | -0.13 to -0.13 (Δ 0.00) | +1.04 to +0.96 (Δ -0.08) | dlr NEUTRAL (held); lev MODERATE LONG (held) | AM 5th pctl (z -2.07); dlr stronger than BTC; top-4 75.4% thin (5L/7S); new shorts entering |
| 7 | VIX | COMPLACENT, PROTECTION EASING | +0.11 to +0.27 (Δ +0.16) | +0.95 to +0.69 (Δ -0.26) | dlr NEUTRAL (held); lev MODERATE LONG (held) | AM net short VIX z -1.26 (protection read per tool convention); lev 76th pctl; new dealer shorts entering |
| 8 | S&P 500 (Consol) | STANDOFF | -0.41 to -0.44 (Δ -0.03) | +0.87 to +0.82 (Δ -0.05) | dlr NEUTRAL (held); lev MODERATE LONG (held) | dealer 27.9th pctl; AM z +0.27; OptZ=-0.14; E-Mini z -0.52 crossed to MODERATE SHORT, lev z +0.93 |
POSITIONING DYNAMICS
Equities (S&P 500, Nasdaq, Russell 2000)
The equity group dealer average sits at +0.58z, carried by Russell and a much-reduced Nasdaq while S&P 500 rounds to neutral. Nasdaq is the week’s dominant move: the maximum-tension book of the prior month unwound from both ends at once, dealers dropping a two-year-high long and leveraged funds covering a matching extreme short, so the OPPOSED EXTREMES standoff has released rather than resolved a directional bet. That normalization is market structure, not a call. Russell now holds the cleanest one-sided read, an outright dealer long against a crowded lev short pressed a full tier below its equity peers, and it carries the only dealer concentration flag on the equity board, so that book is thinner if it turns. The lev short there is the squeeze fuel. S&P 500 is the quiet counterweight, dealers idling near their norm against a moderate lev long, a standoff neither building nor draining; the E-Mini nudged just across into a moderate short while the Consolidated held neutral, a shift within the band, not a regime change. Dealers remain net short S&P 500 in absolute terms throughout.
Russell carries analog data: five prior MODERATE LONG DELTA episodes returned a median +6.0% over the following four weeks with 4 of 5 bullish, against an unconditional base rate of +1.2% median and 60% bullish across all 472 weeks. The median beats the base rate and the hit rate edges it, but the sample is five episodes; treat it as historical context, not a signal.
Rates (UST 2Y, UST 10Y)
Rates now hold the board’s structural tension, concentrated at the policy-sensitive front end just as the inflation print approaches. The 2Y is a three-way stretch: dealers pressed their short deeper, leveraged funds extended an already-extreme long, and measured asset managers sit washed out at the floor of their range, the maximum-tension configuration the narrative flags for escalating unwind risk if a catalyst forces either side. The options caveat applies, so the futures short reads as basis or directional hedging rather than options positioning, and this regime’s measured realized vol has historically run hot. The 10Y is the real-money mirror: asset managers hold an elevated duration long near the top of their range while the dealer short eased fractionally deeper within its tier, and it is the one rates book where the options-implied dealer delta corroborates the futures short. The front-end short and the back-end real-money long leave the dealer curve pulling in two directions into PCE.
Crypto (Bitcoin, Ether)
Crypto dealers are structurally long, so a negative dealer z marks the low end of that long range, not a literal short; neither book is at a true positioning extreme. Bitcoin holds its CROWDED LONG, dealers easing while leveraged funds sit near the top of their range and measured asset managers near their floor, the configuration the narrative reads as unwind risk on the lev side. Ether’s tension is entirely on the measured asset manager side, pinned at an extreme short at the low end of its range, while its dealer book is marginally firmer than Bitcoin’s, which the narrative flags as possible intra-crypto rotation. Both crypto dealer books are thinly held, a handful of traders controlling the dominant side, so read those dealer signals with that structural caveat. Bitcoin’s regime analogs (five prior MODERATE SHORT DELTA episodes, two with usable forward windows) returned a median +3.6% over four weeks with 2 of 4 bullish, against a +2.0% base rate (57% bullish, n=619), an unremarkable read worth no more than context.
COST BASIS LEVELS
Descriptive P&L facts about the aggregate book, not triggers; 2026 testing found no covering response after price crosses a cohort basis. Prices as of August 21.
| Market | Dealer Basis (Low-High) | Current Price | Dlr Gap | Lev Basis (Low-High) | Lev Gap |
|---|---|---|---|---|---|
| S&P 500 | 6,615 – 6,815 | 7,699 | above zone | 6,963 – 7,206 | above zone |
| Russell 2000 | 2,812 – 2,917 | 3,023 | above zone | 2,847 – 2,949 | above zone |
| Bitcoin | 76,563 – 83,649 | 77,099 | inside zone, low end | 72,061 – 78,651 | inside zone |
| Ether | 2,139 – 2,398 | 2,414 | just above zone | 1,879 – 2,091 | above zone |
| VIX | 16.05 – 19.59 | 15.13 | below zone | – | – |
Bitcoin trades inside both cohort basis zones, near the low end of the dealer zone; Ether sits just above its dealer zone; VIX trades below the dealer zone. Equities trade well above every zone. These are descriptive P&L facts, not triggers.
BOTTOM LINE
The board’s stretch rotated off the equity side, where Nasdaq’s month-long squeeze configuration unwound, onto the rate front end, where the 2Y OPPOSED EXTREMES sits with asset managers washed out and leveraged funds still building into PCE seven days out. That single crowded book, not any equity signal, is the structural risk to size around into the print.
Data: CFTC COT Report 2026-08-18 | Prices as of 2026-08-21 | Analysis window: 104 weeks